Buy These 5 Super Stocks Now! (August 2021)

We’ve got 5 new Super Stocks to talk to you about today, which we’re adding to our Super Stocks portfolio that you can follow along with on the Trading 212 app.

About 6 months ago we built a portfolio of stocks which were automatically picked for us using Stockopedia’s Super Stock algorithm. We took the list of the best stocks and then applied a set of rules to whittle it down to the top 20 stocks.

It was an experimental portfolio to see if we can beat the market by building a diversified portfolio with no human judgement and without poring through financial data, without reading the financial news, and without spending any time stressing over whether to buy or sell.

In this video we’ll give a quick recap on the strategy, we’ll take a look at how the portfolio has performed so far, what stocks need to be dropped and which Super Stocks need to be added. We’re going to be looking at the new stocks in a little more detail, so even if you’re not taking part in the experiment yourself you can consider whether you want to add them to your own portfolio. Let’s check it out…

Follow the SuperStock Pie on Trading 212 here.

Get a free 14-day trial and 25% discount on the first year to Stockopedia here. All offers on the Offers page.

Alternatively Watch The YouTube Video > > >

Also check out the MoneyUnshackled YouTube channel, with new videos released every Wednesday and Saturday:

The 5 Best Income & Cash Flow Investments

We’re living in an age of rock-bottom interest rates, where investors have largely given up on cash flow in favour of capital growth, both in the stock market and even in high-stakes new markets like crypto.

My investing journey started with the wise words of Robert Kiyosaki in his book Rich Dad Poor Dad, that “wealth is the measure of the cash flow from [your] asset column”.

For Rich Dad, physical cash in your hand from interest, dividends or rental income is real, and can pay the bills – while holding an asset purely for its growth potential is just placing your hopes in the market.

While we at Money Unshackled are happy to place our trust in the market to go up long-term, we also like at least part of our portfolios to be diversified amongst cash-flowing assets, for the stability and liquidity they provide.

But good quality income generating assets are getting harder and harder to come by. It used to be that you’d just buy some bonds, or even just whack your money in a high-interest savings account.

Now you need to be far more astute – there are still investments with good income returns to be found, but these usually come with a trade-off of higher risk. You need to do your homework to avoid putting your precious money to work for you in the wrong place.

Today we’ve pulled together our favourite collection of income generating, cash flowing investments that are best placed to provide you with a good, consistent income, without the need to take on excessive risk. Let’s check it out!

We’ll be mentioning a few ETFs in this article, and all those mentioned can be bought on Freetrade and Trading 212 – pick up free shares when you sign up to either using the links on the Offers Page.

Alternatively Watch The YouTube Video > > >

#1 – High-Yield Bond ETFs

First up, there’s bonds. Bonds are the stereotypical fixed-income investment class, known for paying out a steady rate of interest to the bond holder.

The problem is that since the financial crisis of 2008, bonds have been known for their incredibly low yields that have kept getting gradually worse.

The interest rate you get from bonds is linked quite closely to the interest rates set by central banks, which as we know is close to zero in the UK and elsewhere.

Not all bonds are alike though. One option is to buy Government Bonds, which from developed countries are super safe but currently pay out typically less than 1% in interest.

Another option is Inflation-Linked Bonds, which claim to offer some protection against inflation, but still may fail to even provide an above-inflation yield.

The option with the highest yields is High-Yield Corporate Bonds, such as what’s offered by the iShares Global High Yield Corp Bond ETF (GHYS). It’s a distributing GBP-hedged ETF with a yield of 3.9%, which is incredible for bonds in today’s climate, but it does have a high fee of 0.55%.

Alternatively, have a portfolio of bond ETFs built for you by opening a Managed Income account on InvestEngine. Choosing the Enhanced risk level will build you a portfolio that is 75% high-yield bonds and 25% dividend equities, with an estimated 4.1% income.

That’s on InvestEngine’s robo-investing area of the platform, meaning they do the portfolio building for you. They also offer growth portfolios that focus on equities. It’s the cheapest service on the market that we’ve seen, with a platform fee of just 0.25%.

But InvestEngine are now ALSO offering a Do-It-Yourself service which lets you trade ETFs for free! That’s NO dealing fees, NO account fees, NO FX fees… nothing! This could be the lowest priced investment platform there is for ETFs.

Use this link to join the InvestEngine platform and you’ll also get a £50 welcome bonus. Or read our full written review of InvestEngine here.

#2 – Peer To Peer Lending

The Peer-To-Peer Lending market is slowly coming back to life after the pandemic, during which most of them went into hiding and stopped new investors from signing up.

But Loanpad, my favourite P2P Lending platform, stayed active throughout and continued to deliver a great return. Loanpad works operationally like a savings account – the main difference being that this is an investment and therefore your capital is NOT risk-free. Unlike bonds, the value of your investment doesn’t change with the market.

Your money is lent out evenly across a portfolio of secured property loans. Your investment is secured against commercial property values, with 2 layers of protection between your money and the risk of capital loss from falling property values.

They offer an interest rate of 4% on a 60-day access account, with interest paid daily. If your income investments are supporting your day-to-day lifestyle, that daily payment of interest really comes into its own.

Also, if you invest £5,000 or more using the offer link here you’ll be given £50 cashback for free from these guys too.

#3 – Dividends… From Crypto!?

Cryptocurrencies like Bitcoin notoriously do NOT pay a dividend.

That’s because they are what’s known as an unproductive asset – they do not generate cash like a business or a loan does, which is how stocks, bonds and P2P lending are able to pay you an income.

But new technologies have been springing up which means that now, cryptos CAN pay you an income.

BlockFi is a bitcoin wallet that works like a P2P Lending site, in that it lends your money out to – in their words – “trusted institutional and corporate borrowers”.

Fig.1: Current interest rates on coins at BlockFi

Above are the interest rates on offer: at time of writing you could get a 5% rate of interest on your Bitcoin, and 9.3% for your Tether. Rates are variable from month to month.

We’re just scratching the surface of this innovation and will be sharing OUR experiences in a future article – stay tuned. Let us know in the comments below if you’ve found a better way to earn money on your crypto outside of normal price growth.

#4 – High-Yield Dividend Stocks and ETFs

The stock market isn’t just for growing wealth – it can also be a great source of income. We cover dividends all the time on this channel, and for our latest thoughts on the very best dividend stocks to own right now, check out this article next.

In it we build a portfolio of the best 20 dividend stocks on Trading 212 using a blend of data from stock picking tool Stockopedia and the Dividend Aristocrats global index. Here’s a link to the Trading 212 pie.

If you just wanted to invest using an ETF, one of our favourites is the SPDR S&P Global Dividend Aristocrats ETF (GBDV). All the stocks on the index have a 10-year track record of maintaining or increasing their dividend. The index dividend yield is currently 4.72%.

Another route to dividend success in the stock market is with investment trusts. Investment trusts have special rules that allow them to hold back cash, to be distributed out to shareholders in bad years – this helps to ensure a constant, steady flow of cash to the investor.

Fig.2: Dividend Hero investment trusts

The industry-standard investment trusts for income are those marked with the Dividend Heroes stamp of approval. The numbers are the number of years that each fund has consistently increased their dividends.

None of these trusts would want to risk their status as a member of this coveted league table by failing to provide you with an annual pay-rise, but you should check the basics like their dividend cover and revenue reserves first.

#5 – Cash-Flowing Property & REITs

You don’t need to part with tens of thousands of pounds to invest in property – you can do it on most investment platforms by investing in a type of fund called a REIT, which stands for Real Estate Investment Trust.

REITs are famous for paying dividends. With property as the underlying investments, there is always a lot of cash flowing in from property rents, and REITs have a rule that at least 90% of rental profits MUST be distributed out to shareholders.

We like to get a broad basket of properties in our REIT investments – the iShares Developed Markets Property Yield ETF (IWDP), with a Total Expense Ratio of 0.59%, does this by investing in 333 separate REITs. Each of these invest into multiple properties in the developed markets and must each have a dividend yield of at least 2%.

Fig.3: Reit Yield history

Here’s the dividend history of the index the ETF tracks, in blue – the FTSE Nareit Developed Dividend+ Index. It typically hangs around 4% but got a little erratic during the pandemic. It’s yield significantly outperforms the yield from the developed world stock markets, in red.

A note of caution against REITs: commercial property is going through a rollercoaster period of change right now, with office culture and working practices in the midst of a fast-paced work-from-home revolution.

What are now offi ce buildings might soon become residential flats. City centres will be fundamentally different.

What about residential? The residential sector is doing very well recently, with house prices AND rents soaring.

There ARE some REITs that focus on residential properties like apartment blocks, but these are few and far between: Equity Residential (EQR) is one example and has a 3% yield, which is forecast to grow.

We still think the best way to invest in property is by buying a few Buy-To-Let rentals in the UK.

Regular viewers will know that most of my wealth in is property, as we showed in this article. My cash-flow rental profits are about 9% – the capital growth is another matter, which because of mortgage leverage is around an additional 12%.

That 9% income is a significant game changer – I use the income from my properties as a base layer of income to support my lifestyle, meaning I can invest more of what I make elsewhere.

The higher income return of BTL reflects the increased effort involved – it’s the only investment we’ve covered today that can’t just be managed by a few button-taps on an app.

When To Avoid Income Generating Assets

Income generating assets are great for portfolio diversification as an add-on to your growth assets, or for people who have reached the point that they can retire on their investments.

If you’re still on the journey to financial freedom and want to build your wealth further, assets which focus on capital growth typically have better total returns than cash-flowing assets.

Using the stock market as an example, we would prefer for most of our portfolios to be invested in stocks with low dividends, as the act of paying a dividend (a) provides opportunities for the taxman to take a slice of your money, and (b) means the company cannot reinvest that cash in its operations.

Part of the reason why tech stocks have experienced a boom over the last decade is that they generally don’t pay any dividends – all that cash goes into product development instead. They can invest shareholder’s profits better than the shareholders could themselves.

When Income Is Essential

That said, I wouldn’t be without my investment property income. It has provided a safety cushion of monthly cashflow which has meant I could safely leave a job I hated, could start a business without needing it to pay out profits straight away, and now means I could survive even the rockiest patches of self-employment.

Would I have the same stability from a portfolio of growth stocks?

The eventual goal of most people in the Financial Independence community is to build an investment pot of many hundreds of thousands of pounds worth of stocks.

A small portion of their stocks can then be sold each year to provide an income, without upsetting the overall portfolio’s growth by too much.

We both intend to follow this plan too. But that is years away. Having extra income streams NOW oils the gears, and improves your ability to grab life opportunities.

What do you think about income generating assets, and what do you have in your portfolio? Join the conversation in the comments below!

Written by Ben


Featured image credit: ESB Professional/Shutterstock.com

Also check out the MoneyUnshackled YouTube channel, with new videos released every Wednesday and Saturday:

How To Retire With A £1 Million Pension At Age 50

In previous articles we’ve looked at retiring really young, and there were two themes that were evident:

1) You had to save and invest an enormous amount of money; and

2) Pensions were of little use because they cannot be accessed until your mid to late 50s.

However, if you are willing to retire a little later, such as in your 50s, pensions are an incredibly powerful tool for building up a huge investment pot that can provide you an income for the rest of your life. What’s more, if you’re aware of smart strategies – the kind that we’ll introduce you to today – then you can in effect access your pension pot early.

In this post we’re looking at how you can retire with a £1 million pension at age 50, in today’s value of money. We’ll cover how much you need to save, the benefits of starting as early as possible, some strategies at your disposal, and more. Let’s check it out…

If you’re going to do the following strategy properly, at some point you’re likely going to need to use a SIPP. We’ve compared them all and handpicked our favourites. Check out the Best SIPPs page for guidance.

Alternatively Watch The YouTube Video > > >

Do You Really Need A £1 Million Pension?

How much retirement pot you really need is dictated by your desired income. The more income you want, the bigger the pot required!

Which.co.uk spoke to thousands of their members and they published some really interesting figures on how much money you need in retirement, whether you’re living alone or in a couple.

Couples would need just £18,000 for the essentials, £26,000 for a comfortable income and £41,000 for a luxury lifestyle. The comfortable lifestyle covers all the basic areas of expenditure and some luxuries, such as European holidays, hobbies and eating out. The luxury lifestyle includes all this plus more, such as long-haul trips and a new car every five years.

If you don’t mind popping your clogs and having nothing left to leave to your family, friends or favourite charity, then you’ll be able to drawdown on that pension much faster than someone who doesn’t want to deplete the pension pot. If your goal is to retire at 50, as per the title of this article, you might want to consider trying to maintain the value of your pension for as long as possible.

A good rule of thumb is to use the 4% safe withdrawal rate. We won’t cover it today because we’ve covered it a lot previously but in theory you would need a pension pot of £1,025,000 to achieve that £41,000 per year luxury lifestyle for a couple.

The pension lifetime allowance for most people is £1,073,100 in the tax year 2021/22. Up until the allowance limit, pensions are a very tax-efficient way to save for retirement. Past this mark, they start to become inefficient as the government start hitting you with hefty tax charges.

If you’re hoping to hit that £1m pension and you’re in a couple, you should definitely consider splitting it across the pair of you so you’re less likely to fall foul of the lifetime allowance from further growth, but at the same time you also need to consider the most tax efficient way to save.

How Much Do You Need To Save To Get To The £1 Million Mark?

For all the following figures, we’ve used a 5% real rate of return. We always assume that market returns will be 8% based on history and then deduct 3% for estimated annual inflation and investment fees.

Let’s first look at what you need to save, assuming that you’re going to save into a pension until you hit state retirement age at 68.

The amount you need to save per month depends on your age. As you can see in this chart the younger you are your required savings per month are far lower than if you start later in life. If you’re 25 you will only need to save today’s equivalent of £555 per month. But if you start at 40 you will need to save almost triple at £1,359.

We’d say that for anyone under 30 who wants to be a millionaire it is absolutely within their reach. 30-year-olds only need to save £737 per month. In fact, we’d even say that if you’re 40 you can still quite easily become a pension millionaire despite the seemingly higher savings rates required.

You can access your private pension before the state pension age, so let’s recalculate as if you want to access as early as possible. The current minimum pension age for taking benefits from a private pension is age 55. This is expected to increase over time. For this example, we’ll go with 58, which is probably most likely for those currently in their 30s and younger.

The required savings per month is noticeably higher than when the target date was 68. We have 10 years less to contribute and 10 years less of compounding returns. The later you start the harder it gets, like before, but every year later is so much harder. This is based on 58. Doing it by 50 is probably going to be a Herculean task. Let’s take a look…

This chart looks different to the other charts because you can’t actually access the money in the pension at 50. So, although you will stop contributing at 50, the pension pot will continue to grow until 58, hence why all the lines come together at 50.

What might surprise you is that the savings per month for the younger ages are not that different to those required for retiring at 58. At that point growth is far more important for compounding than the relatively low contributions.

Let’s look at all the figures together to more easily see how they compare. The later you start investing would make getting to £1m a very difficult task indeed. But for those who are currently 30, retiring by 50 looks very doable as you only need to save £1,625 per month.

I imagine that some of you are screaming expletives at us right now because unless you’re on the younger end of that scale some of those numbers are beginning to appear ridiculous. Well let’s take a look at how those numbers can be drastically cut down.

Taking An Axe To The Required Savings

All the numbers we’ve seen so far are the total contributions. The beauty of pensions is that thankfully you don’t need to pay all this yourself. You will get employer contributions and tax-relief, which can be enormous.

There’s also a smart hack that some companies use to avoid National Insurance (NI) called ‘salary sacrifice’, which saves you a bucket load of money. You can then make further contributions to your pension with the tax saved.

Better still, some companies who operate a salary sacrifice scheme will also pass on their employers NI savings of 13.8% to your pension pot too.

All in, this will be an effective boost of 83.8% for higher-rate taxpayers on top of whatever you put in. For lower-rate taxpayers it works out at a still impressive 53.8%.

If that wasn’t enough, if you have outstanding student debt, using salary sacrifice to increase pension contributions lowers the amount you need to pay back each month. This would further increase those figures to 98.8% for higher-rate taxpayers and 65.1% for lower-rate taxpayers.

For the purpose of the rest of the article we’ll assume you have no student debt and so don’t benefit from avoiding that.

Also, some companies don’t offer a salary sacrifice scheme simply because they’ve never heard of it. There’s no harm in asking and perhaps educating them why they should introduce salary sacrifice.

How Much Do You Really Need To Save To Get To The £1 Million Mark?

This is what both a higher-rate taxpayer and their employer will contribute to their pension, plus the tax relief they will receive, in order to hit that £1m pension. In this first example shown we’ve assumed a salary of £75,000 and 10% matched employer contributions.

Most companies will pay less than 10% but there are also many who do respect their employees and pay this or even more. If you’re serious about building a £1m pension, then it might be in your interest to seek a good employer out.

That 10% matched limit is why the company contributions are frozen at £625 for some of the ages. It means that you will have to pay in more yourself to compensate for lower company contributions. Hence at 35, to retire at 50, you will pay in £1,014 per month but only receive £625 from your company. Of course, if you earn more or have higher matched contributions your company will pay more than this, meaning you yourself can pay less.

Let’s look at what a lower-rate taxpayer earning £45,000 would have to save. As you can see the lower salary means the employer contributions are capped at £375 per month causing you to have to contribute more yourself. At 30 you would only have to save £812 a month to retire at 50 with a pot that would soon grow to £1m. For those age 40, the required monthly savings are a tall order, requiring £2,533 per month. This can be slashed for those willing to work until 58 and later.

How To Access Your Pension at 50?

As we mentioned earlier you cannot access a private pension until probably 58 in normal circumstances.

Our first lifehack is to take out debt at your chosen retirement age of 50, most likely mortgage debt as it’s very cheap, to fund your lifestyle until you reach the pension age of 58. When you can finally access the pension, you can take a 25% tax-free lump sum, which you could use to pay down the debt should you wish. If you did manage to build a £1m pension that’s a tax-free lump sum of £250,000.

If you had remortgaged your property and extracted £250,000 at age 50, that would give you £31,250 each year to live on. This could be supplemented with any other savings or investments that you hold outside of a pension, such as an ISA.

Our second lifehack also involves using debt smartly, but in the early years of pension building.

The irony of investing is that it’s far preferable to inject lots of money in the early years rather than later, in order to produce better compounding. But inevitably, your salary will be lower in the early years and your pension pot will be small, meaning it’s only in the later years that your pot grows to a size that the compounding starts making an impact.

Why not flip that on its head? By taking on a large amount of low interest debt in your twenties or thirties and investing it into your pension, you can then watch as your pension snowballs over the years from strong compounding returns.

Preferably the debt will be long term, cheap mortgage borrowings like the first hack, so you can defer paying it back for 2 or 3 decades, as before.

Other Key Tips

#1 – Consolidate Old Pensions

Most people will have several jobs or more during their lifetime and accumulate multiple pensions. This not only makes them a pain in the butt to manage but also many of them will be expensive and underperforming.

In many cases it’s worth consolidating them into one easy to manage, low-cost SIPP. Before doing this do your research and perhaps speak to a financial advisor if you’re unsure.

#2 – Partial Transfer Your Existing Workplace Pension

Following on from the last point, it might be worthwhile partially transferring your existing workplace pension into a SIPP if your existing pension is costly or badly run. Many workplace pensions have poor investment options and are likely to not be invested according to your risk profile and goals.

We’re suggesting a partial transfer because otherwise your employer will likely stop contributing, which you want to avoid. Before doing a partial transfer make sure your existing pension provider allows this.

#3 – Ramp Up The Risk

Generally, the higher the risk, the higher the potential reward. To build a £1m pension is no mean feat and will require great returns. In this video we think we’ve been quite conservative using just 5% real returns, and if you increase risk, we think there is a good possibility that you will get returns exceeding this.

#4 – Use Your Spouse’s Pension Too

If you’re fortunate enough to have a spouse who has a good workplace pension too, then take full advantage of this. You’ll get even more employer contributions and will now have two salaries to make quick work of those required savings rates.

Also, on your own you will likely eventually breach your pension lifetime allowance if you have a pot already worth £1m at age 58 as it will continue to grow. If that was spread across two people’s allowances, that is much better.

#5 – Don’t Neglect Your ISA

Pensions are incredible, but Stocks & Shares ISAs are also extremely powerful in their own right. Together they can be used to balance tax efficiency and accessibility. Check out this article and video next to learn how they can be strategically used together to retire early.

Were you surprised by just how little of your own money is required to become a pension millionaire? What’s your retirement strategy? Join the conversation in the comments below.

Written by Andy


Featured image credit:  Rus Limon/Shutterstock.com

Also check out the MoneyUnshackled YouTube channel, with new videos released every Wednesday and Saturday:

InvestEngine Is A Game-Changer! | Completely Free ETF Investing Platform Reviewed

InvestEngine is a game changing new investment platform that lets you trade ETFs for free, beating the popular commission-free trading apps which all have at least some fees.

The opinions and insights in this review are our own and are unbiased. We only do reviews if we think there’s a service that you really need to hear about, and this is one of those times.

InvestEngine is a hybrid investment platform in that it is really two platforms under the same name: one is a totally free ETF investing platform whose main competitors are free trading apps like Trading 212 and Freetrade; and the other is a super low-fee robo investing platform, comparable to the likes of Nutmeg.

So, if you are either a “do-it-yourself” index investor or a hands-off “manage-it-for-me” investor, InvestEngine has you covered, but with significantly lower fees than can be found elsewhere on the market.

And as our regular viewers will know… fees are everything. Fees are the ONE thing you can control with certainty over a portfolio’s life. Get the fees right, and it could make the difference between a 6-figure and a 7-figure portfolio.

Well, InvestEngine have got the fees right. Should InvestEngine now be the new place to store and grow your wealth? Let’s check it out!

If you want to give InvestEngine a try and see what all the fuss is about for yourself, they currently have a sign-up offer where you get a £50 bonus added to your portfolio balance if you deposit £100 or more. Find the sign-up offer here or on the Money Unshackled Offers Page.

Alternatively Watch The YouTube Video > > >

Hi guys, an update (28th July 2021): DIY ISAs are now live!! 😎 You can also now have multiple DIY portfolios. To set these up, use the website version of InvestEngine, but the app should have this functionality also in the coming days.

Read the full review of InvestEngine by clicking here or on the image below ↓

Full written written review here

Written by Ben


Featured image credit: McLittle Stock/Shutterstock.com

Also check out the MoneyUnshackled YouTube channel, with new videos released every Wednesday and Saturday:

Do Index Funds & ETFs REALLY Beat Actively Managed Funds?

S&P Global, the index provider behind the S&P 500 and other stock indexes, provide some great insight into the markets which help everyday investors like us to understand the investment world better.

One of these insights is the SPIVA report, SPIVA being an acronym for S&P Indices Versus Active. It’s a comparison between actively managed funds and the passive indexes that they are benchmarked against.

With this report we can see exactly how stock market indexes, and hence index tracking funds and ETFs, are actually performing versus actively managed funds.

From this we can better answer questions like: “if I want my wealth to grow, should I invest in a managed fund with a famous reputation like the Cathie Wood funds, or in an index like the S&P 500?”; “Can fund managers help you avoid the worst impact of a market crash?”; and “are top performing fund managers skilful, or just lucky?”.

In this article we’ve got the answers to all these questions and more. We’re going to try to put to bed once and for all the argument between active and passive funds. Let’s check it out!

Commission-free trading app Freetrade has over 300 index-tracking ETFs available, including the FTSE 100, S&P 500, and commodities like gold and silver. There’s even niche areas like cybersecurity and green energy ETFs too.

Sign up using the special link here with as little as £2 and you’ll be given a free share worth up to £200!

Alternatively Watch The YouTube Video > > >

The Active vs Passive Debate: Why It Matters

The reason why actively managed funds still exist is the lingering belief that with enough skill, a fund manager can consistently beat the market, or technically speaking, outperform their index benchmark.

When Vanguard founder Jack Bogle challenged this view decades ago with his low-fee index funds, it began a performance war between the managers and the indexers over which approach is best.

Should you pack your portfolio with actively managed funds chosen for their managers’ reputations, kooky strategies, and past performance? Or with index funds and ETFs chosen for their geographic coverage and low fees?

The Main Finding

The main takeaway from the report is that whatever geographical region you look at, indexes have outperformed managed funds the vast majority of the time.

US Breakdown (amounts over 50 = a win for Index Funds)

If we drill into the US, we can see the detail. These numbers are the percentage success rate of indexes vs active funds, with better success rates for the indexes in darker shades of red.

We see that over 5 years, active funds have a terrible success rate overall, but might see a better performance over a 1-year period.

Even over just 1 year, it is still a less than half-chance that your actively managed fund will beat the market. As investing is a long-term game, the 5-year figures are pretty damning for managed funds.

It’s not just Equity funds that fail to beat their index benchmarks – active bond funds also fail to beat ETF and index fund equivalents the vast majority of the time.

It’s worth noting that there were certain market niches that fund managers were able to beat the market consistently over 1, 3 and 5 years.

These were mid-cap and small-cap growth stocks.

There are good reasons to think that at the small-cap end of the market, fund managers have a better chance to beat their benchmark, because there is less information than at the large-cap end of the market.

There is almost no chance that a fund manager can trade Apple or Amazon at a market beating discount, because these companies are so well known that everyone else has the same information.

But maybe by focusing on tiny companies they can eke out an advantage.

The data here certainly holds open that possibility anyway. But when we zoomed out to a 20-year horizon, a paltry 4%, 10%, and 6% of large-, mid-, and small-cap growth funds beat their benchmarks, respectively. So maybe not!

Europe Breakdown

If we look at Europe, it’s the same story. The S&P Europe 350 index, which includes the UK as some of its largest holdings, outperforms actively managed funds 75% of the time over 5 years. But short-term punts have paid off most of the time.

Can Active Fund Managers Steer You Through A Downturn?

Surely the benefit of having a human at the helm is that when a major storm hits, you have a captain to steer you through the chaos. That’s a nice thought, but what does the data say?

Large Cap performance

This chart shows the percentage of actively managed US large-cap funds that beat the S&P 500 index in any 1-year period going back to 2006.

One obvious point to note is that only in 2 years were the active funds more likely to outperform the S&P 500.

One of those years though was 2009, a terrible year for the stock market which was during the global financial meltdown, which started in 2008.

Active funds were slightly more likely to outperform their index in this year. Funds failed to outperform in 2008 though. Or in 2020, with the Covid Crash.

So it seems that active managers are not especially well placed to steer you through a downturn, at least for large-cap stocks.

A separate point to note is that the trend of active funds’ success rate is falling  the trend line is down by 10% over the 14-year period.

Small Cap performance

If we look at small-caps, the area where fund-managers should excel, we again see a fall in the success rate trend, but 2009 was an incredible year for actively managed small-cap funds.

This did however come after one of the worst performance years in 2008. And 2020’s performance was mediocre.

So, can active managers better steer you through a downturn? The data says… there’s no reason to think so!

The Winning Managed Funds: Was It Skill, Or Luck?

Maybe we’ve been a bit unfair to actively managed funds. Yes, most of them fail to perform, but there ARE STILL a load of winning fund managers that you can put your trust in, right?

After all, 25% of American and European managed funds WERE able to beat the market over 5 years. But did their investment results come from skill, or luck?

That distinction is important, because genuine skill is likely to persist into the future (which is all that matters to an investor), while luck is random, and those results are unlikely to continue.

One way to measure a fund manager’s skill is to look at how long that good performance hangs around relative to its peers.

SPIVA’s Persistence Scorecard attempts to distinguish luck from skill by seeing what happened to top performing funds from 2015 over the next 5-years.

US Persistence

This chart shows that active management outperformance is typically short-lived in the US market. Just 39% of top performers stayed in the top half of the league table after 5 years, with 20% being relegated to the bottom half, and 13% were gone altogether.

A further 28% were the same fund in name only. Funds often have to drastically change their approach to survive, and an investor in such funds might find they are no longer invested in the sectors they initially chose.

Europe Persistence

If we look at the Europe market, which for this purpose includes the UK, some analysis has been done into how many funds stayed in the top quartile of the league tables after 2, 3, 4 and 5 years. The top quartile is the best performing 25% of funds in any 1 year.

Of the Europe Equity funds based in Europe, after 2 years, only 33% of the top performers could still be called top performers.

Most of the other equity categories were much worse even than this. And look at what happens in years 3, 4 and 5. In year 3, only 3% of top performers from year 1 were still in that top quartile.

If you think that investing should be done for the long-term, why would you want to trust your money to a top performing managed fund, when data like this proves beyond a reasonable doubt that most of their performance is down to luck?

After 5 years, less than 1% of European Equity managed funds were able to maintain their performance.

Other Key Findings Of The SPIVA Report

#1 – Fees Really Matter

The report confirmed what we already knew; that fees have an important impact on fund performance. Actively managed funds typically have FAR higher fees than passive index funds, and this massively hinders them from beating or even matching their benchmarks.

An active fund must cover the high costs of its analysts’ salaries. Even if picking the right stocks were simply a flip of a coin, the fund managers would still be worse off most of the time due to having to over-perform simply to cover the costs of their own high fees.

The complexity of the investment strategy in some managed funds can also raise the fees, as the fund is perceived to be doing something clever.

In our view, it seems that overly-complex investments mostly exist to profit those who create and sell them, rather than their investors.

#2 – Active Funds Who Invest In Foreign Markets Do It Poorly

Think, for instance, of a London based actively managed fund which invests in US stocks. On average, it will perform worse than a New York based fund which invested in US stocks.

Part of this might be to do with foreign dividend withholding taxes, which shaves a slice of returns off the top for the US taxman.

But part of the reason is surely also to do with local knowledge. A US investment firm may know a little more about the American companies that its fund managers shop at, or that they see every day in the newspapers, than a UK investment firm would.

We can take from this that if you want to invest in the US market from the UK, or any other foreign market for that matter, you’re even more likely to do better with an ETF than by using an actively managed fund.

#3 – Fund Size Matters

The data shows that generally, larger funds were more likely to be able to beat their benchmarks than smaller funds were.

So if you ARE going to use an actively managed fund, a fund with Assets Under Management in the BILLIONS of pounds should perform better than one with only millions.

So When SHOULD You Use Managed Funds?

As it stands, there seems to be little reason to invest in actively managed funds, based on this report. Sure, there may be some niche areas of the market that are not adequately covered by index funds and ETFs. But even then, can you be sure that you’re particular niche will be the one that beats the market?

We subscribe to the school of thought that believes we should all be investing broadly into a globally diversified pool of equities, with many countries, market sectors and asset classes covered – or at least into a major index like the S&P 500, which can be tracked cheaply and includes companies that operate globally.

The “Owning The World” approach is very likely to provide you with solid market average returns.

There’s nothing wrong with market average. Don’t mistake market average for an average return.

If you’re able to score the market average, you’re very likely to be beating the vast majority of investors who try in vain to beat the market, and end up losing out.

In league table rankings, index funds are unlikely to ever be amongst the highest flyers – but nor are they likely to be at the bottom.

There will always be actively managed funds who luck their way to the top, to crash out the next year and be replaced with another lucky fund. Meanwhile, the investors riding the index will be coasting their way to a comfortable retirement.

Which funds form the core of your portfolio? Are they actively managed or tracking an index? Join the conversation in the comments below!

Written by Ben


Featured image credit: leolintang/Shutterstock.com

Also check out the MoneyUnshackled YouTube channel, with new videos released every Wednesday and Saturday:

All offer links here.

Don’t Do This… Our 5 Biggest Money Regrets

“It’s good to learn from your mistakes. It’s better to learn from other people’s mistakes.” – Warren Buffett.

In today’s post we’re looking at our 5 biggest money regrets. Hopefully, you’ll find this article entertaining but more importantly we hope you find it useful.

Some of these regrets are in direct opposition to popular opinion, which in some cases is why it has taken us so long to identify the bad practice in the first place. We like to think that we’re quite knowledgeable when it comes to financial matters, but even now we’re still perfecting our financial strategies, making mistakes along the way, and sharing it all with you. Let’s check it out…

If you’re looking to get a boost to your investments head over to the Money Unshackled Offers page where platforms like Freetrade, Trading 212, Stake and others are giving away free stocks and welcome bonuses when you sign up.

Alternatively Watch The YouTube Video > > >

What This Article Is Not About

If you’ve ever read or watched anything before on the topic of money regrets, you might be expecting us to reel off a list of predictable mistakes that any self-respecting financial blogger should not be making in the first place.

Things like racking up a huge amount of consumer credit card debt is the obvious one or blowing their life savings on a brand-new car. We’ve always been sensible with money and never squandered it, so we don’t have any major spending regrets as we’re too damn tight!

Sure, back in my student days I was living in my overdraft just like everyone else seemed to be doing, but it was interest free, and the debt was small enough to easily be paid back with a summer job.

Our financial regrets are stuff we would actually go back and change if we could.

Regret #1 – Focussed On UK Stocks And Dividends

This one must have cost me tens of thousands of pounds since I started investing properly in 2010. All we ever heard back then was the FTSE this and the FTSE that. The financial news would come on and tell you how many points the FTSE 100 had moved that day but there was never any mention of the performance of a world index.

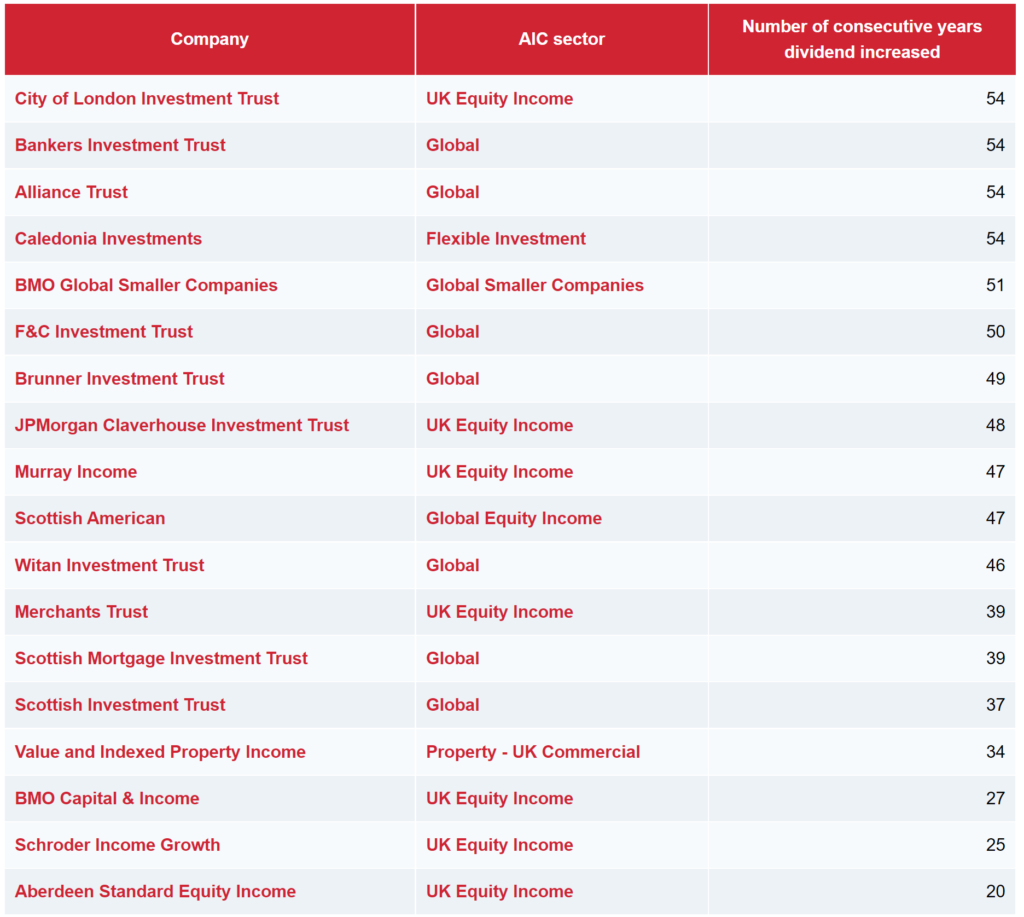
Investment platforms would actively discourage investing in foreign markets like the US by charging extortionate trading fees on non-UK investments. Popular investing website The Motley Fool would run seemingly daily articles of 5 UK dividend stocks that every investor needed in their portfolio.

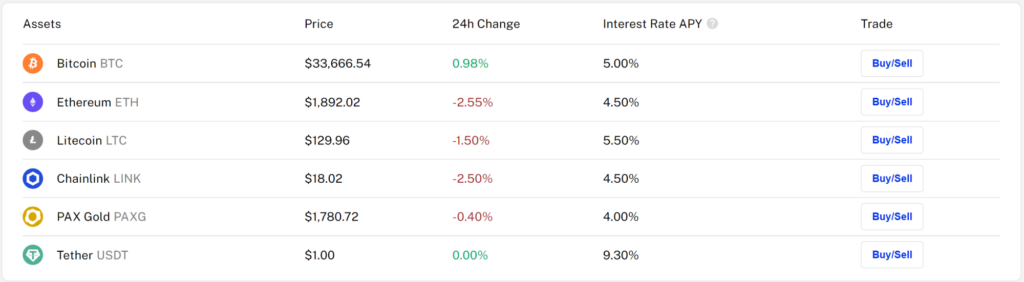
Dividends were spoken about as if they were the only way to make money in the stock market. You’d hear facts like 40 or 50% of overall long-term returns come from dividend reinvesting.

With all this potentially misleading information it’s easy to see why a new investor might be led down the wrong path.

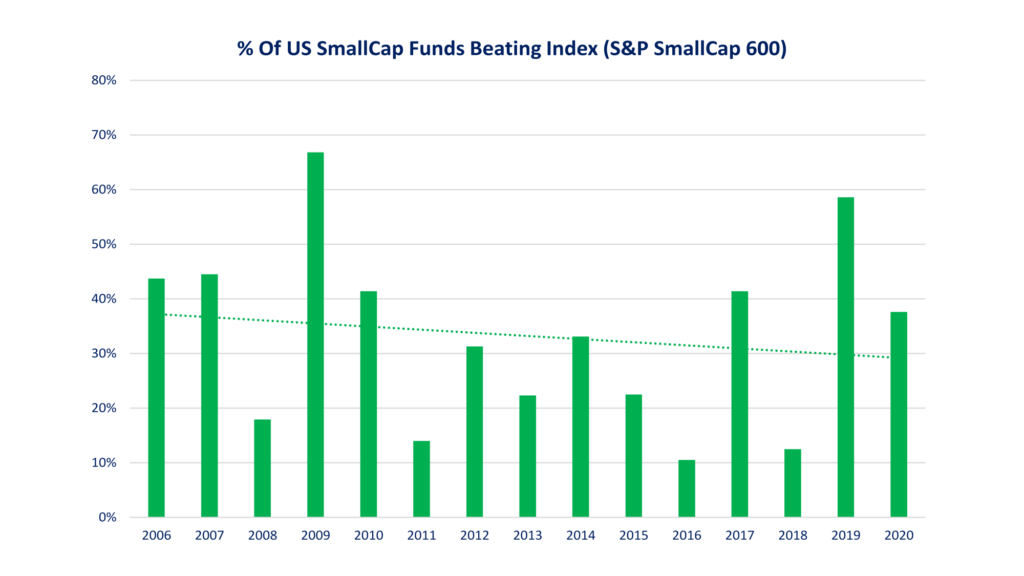
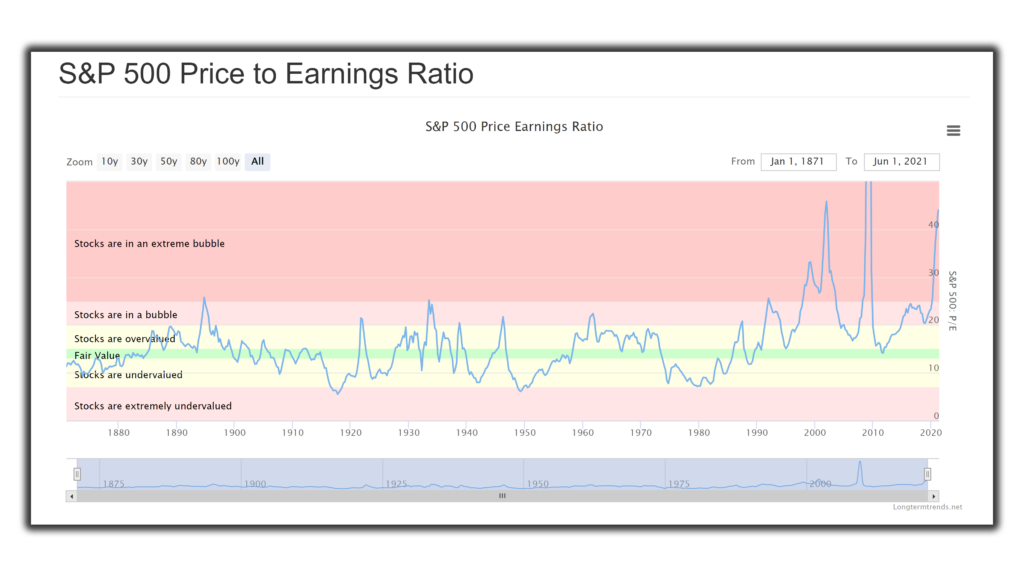
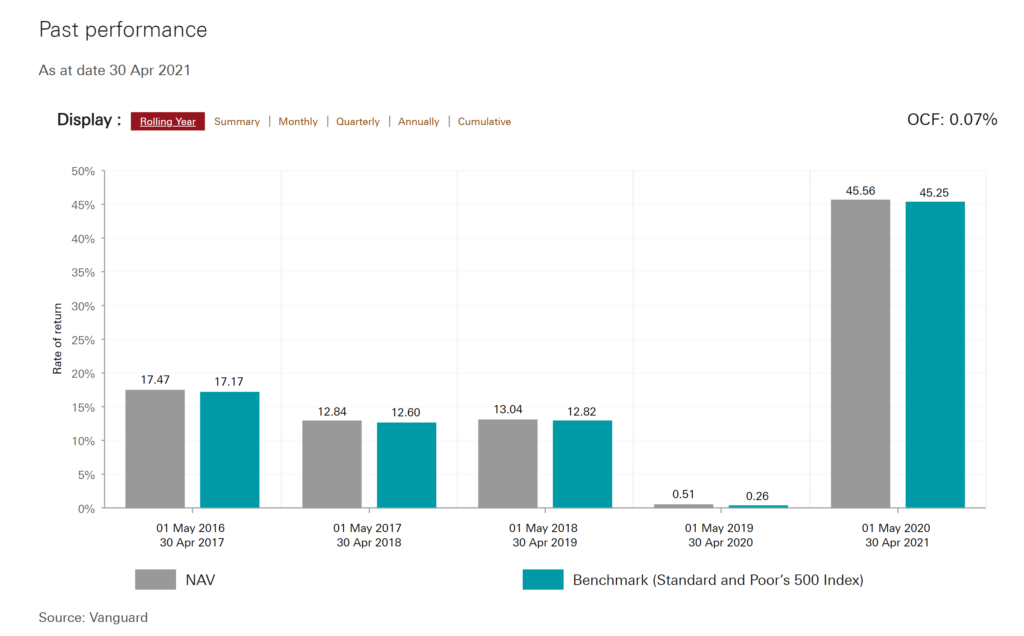
Over the last decade or so the returns on UK stocks have been lacklustre at best, while US stocks have powered ahead. With hindsight it’s always easy to say you should have done this or should have done that. It’s not the past returns though that make me regret going heavy with UK exposure. It’s the fact that UK stocks only make up around 4% of the world’s market capitalisation.

Also, with my human capital (that being my ability to work and live) limited to the UK, it makes no sense to invest with home bias. Exposure to the whole world – or at least mostly US stocks which make up about 55% of the world’s market cap – would be a far more sensible allocation.

As for dividends, there’s nothing wrong with them per se, but by only targeting high yield stocks meant better growth stocks like Amazon, Google and Facebook were ignored. You don’t need to be an investor to know these stocks have left most others in their wake.

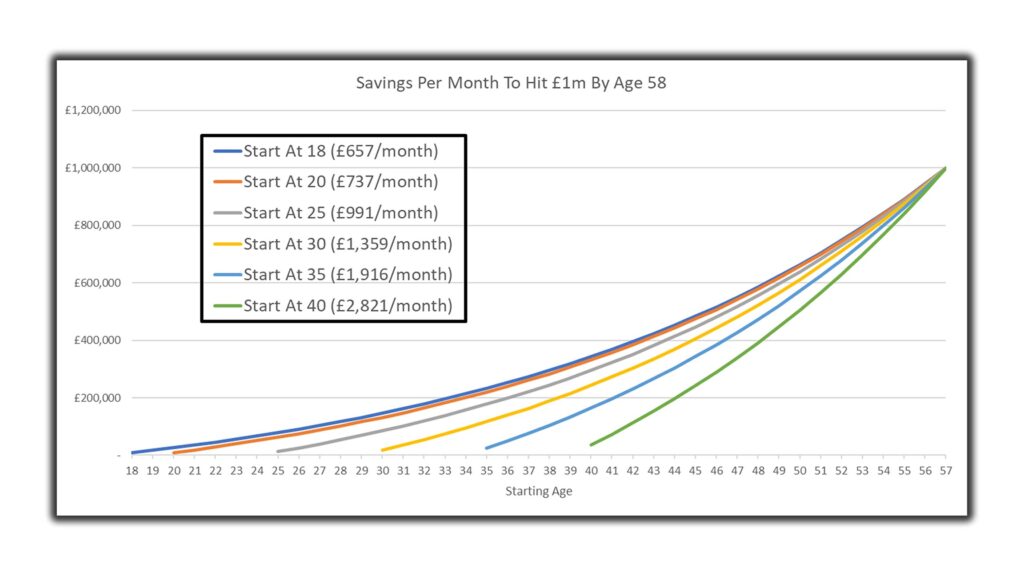
Regret #2 – Wasting Our Early Years

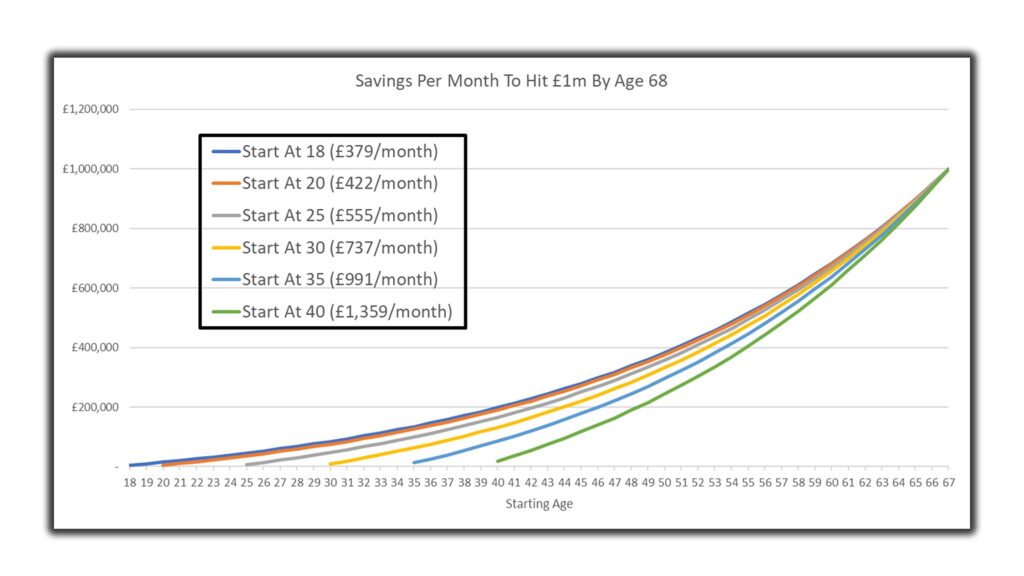
This regret is two-fold. Firstly, we both wish we had started investing earlier. Growing up, my parents saved up a small amount of money in a building society for me and I remember how cool it was to see money making money – back then of course interest rates were something like 5% so passive income and the magic of compound interest was clear for all to see.

However, you have to wonder what would have happened to my small pot had it been invested instead. Moreover, later in my early twenties when I did start investing, I was so slow to shift what cash I had into equity, that much of my cash was sitting idle as the stock market went on a bull run.

For Ben (MU Co-founder), he sat in cash even longer. But rather than gradually moving from cash to equity as I had, he had an epiphany after reading Rich Dad Poor Dad at age 27, which was six years ago.

From that moment on he was all in. He went on a buy-to-let shopping spree, buying as many as he could as fast as he could. This even included extracting equity from his own home to jumpstart his asset purchases.

The second part of this regret is about wasting our early years when we had so much time on our hands.

Ben and I lived together at Uni with a bunch of other likeminded people, all of whom had big dreams like we did. Looking back, we had so much time on our hands but did nothing productive with it. We drank, watched Lost, and became rock gods on guitar hero. Could that time have been used to build a business empire like Mark Zuckerberg did?

Most people who don’t start a business use the excuse that they have no time, but we know from having lived it and squandered the opportunity, that students have an abundance of time. We literally must have only spent around 15 to 20 hours a week doing Uni work, spending the rest of the week chilling. If only we had that time back now!

Regret #3 – Pigeonholing Ourselves In An Unscalable Career

A lot of people’s careers start when they’re around 17 and they choose a university degree with little understanding of where that leads to in terms of career. That decision in many cases dictates what they will likely do for the rest of their life. A frightening proposition for any 17-year-old, if only they understood the impact of their decision.

At best, a clued-up youngster might consider the earnings potential of different careers and choose one of the best paid.

Back then, we had no idea about the difference between trading time for money, owning passive income streams, or scalable income. We ended up learning accounting which does lead to a relatively highly paid job, but the work doesn’t lend itself well to scaling.

The best paid work is scalable, which means it can be rolled out to multiple customers with little to no additional work. For instance, if you provide online training courses, then you can create a course once and sell it to an unlimited number of customers.

The same can be said for software engineers who are able to code computer programs, apps and games that have endless reach. Do you remember the game Flappy Bird? Its developer said that it was earning $50,000 a day during its peak popularity. Incredible. That’s the difference between scalable income and trading time for money.

Generally, once you’ve learnt a skill, you become pigeonholed, but we think anyone that has something between their ears can apply themselves to any profession.

While basic accounting is an absolutely vital skill for any business owner to possess, it probably isn’t necessary to study for 6 years of combined university and professional level qualifications in the subject. Better we think, to learn a scalable set of skills.

Regret #4 – Lack Of Leverage

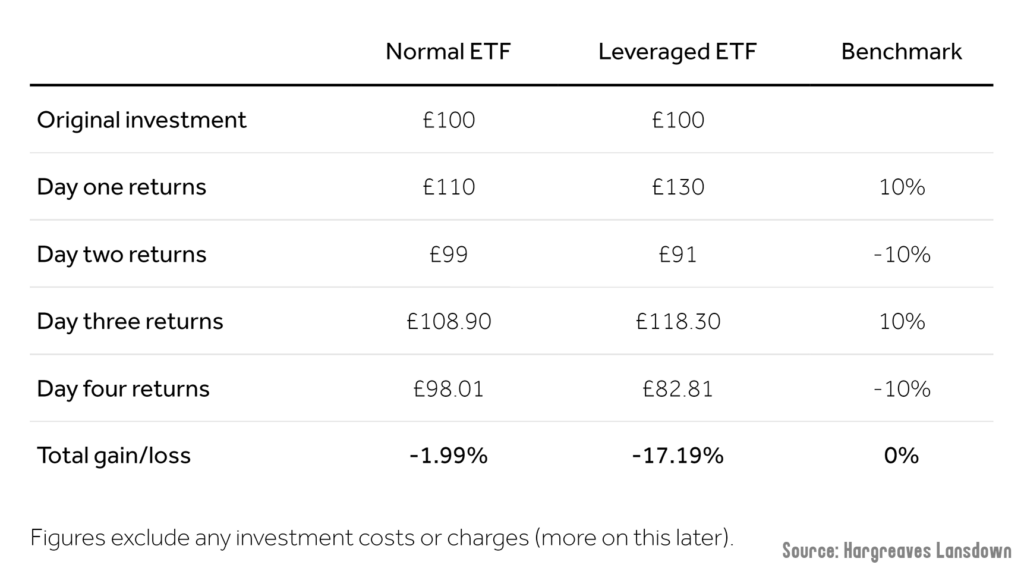
Leverage is the use of debt to amplify potential returns. So, if the stock market rose by, say 8% and you were using 3x leverage, you would get 24% returns, less any financing costs. High returns like this make an enormous impact when compounded over time.

Our regret of not using enough leverage runs contrary to what most people feel about borrowing money to invest. Most people believe that debt and therefore leveraging is inherently risky and so won’t ever touch it. They may regret using debt, while we regret not using enough of it.

Leverage is a useful tool that can enhance returns when used appropriately. For us, the biggest money risk is having to spend a lifetime working and not having the time left at the end of a career to live the life of our dreams. Leverage can be used to more easily achieve that dream life!

In fact, we’ve recently been swotting up on the use of leverage and came across some really interesting theories. One put forward in the book Lifecycle Investing, argues that we should all be using leverage in our early years to diversify across time, and the book makes a compelling case that this actually reduces risk. Can you believe it? Leverage being used to reduce risk!

We’ll probably do a full video on this soon because the theory is so eye-opening and deserves a full explanation, but to summarise, the theory says that because you have so little wealth at the beginning of your life, the movements of the stock market make almost no difference relative to the impact it has later in your life when your pot is large.

From a temporal diversification perspective, it’s as though your 20s and 30s didn’t even exist.

Another use of leverage that we’re only just beginning to use ourselves is a risk parity strategy. Again, this needs a dedicated video as we can’t give it the credit it deserves here.

In brief the asset allocation in a portfolio is adjusted, so that the assets have the same risk level, but then leverage is used to obtain the desired return. This risk parity strategy should have the same return as a stock dominated portfolio but crucially with less risk.

For example, a traditional portfolio might be 60% stocks and 40% bonds, but stocks contribute 90% of the volatility. A risk parity strategy might allocate 20% stocks and 80% bonds but then leverage the portfolio to obtain the desired returns.

Regret #5 – Trapped In A Fixed-Term Mortgage

Fool me once, shame on you; fool me twice, shame on me. Well, it looks like Ben’s a fool (his own words) as he’s made this mistake twice and regretted it both times.

Fixed-term mortgages look appealing. You can lock-in a low interest rate for a number of years and he’s done this with a 5-year fixed term mortgage twice.

Fixed-term mortgages have their uses, such as giving you certainty over repayments – you won’t ever get any nasty surprises from your bank telling you your monthly repayment is going up. But the downside is that they’re very inflexible, and life is bound to throw up many surprises during a 5-year timeframe.

The first time he wanted to release some equity from his house to invest in Buy-To-Let property, he was forced to pay an early repayment charge of a few grand. He then somewhat sensibly chose a 2-year fix, which allowed him to extract more equity just 2 years later.

At the end of the two years, he convinced himself that he wouldn’t ever want to extract equity again, so foolishly (his words again) opted once more for a 5-year fixed term.

Surprise, surprise, he changed his mind and wants to extract some further equity now that the property market is sky high – only to be facing another hefty early repayment charge. The moral is, think twice before locking yourself into a mortgage term… and if thinking twice doesn’t work, definitely don’t get it wrong a third time!

What financial regrets do you have and why? Join the conversation in the comments below.

Written by Andy


Featured image credit:  Golubovy/Shutterstock.com

Also check out the MoneyUnshackled YouTube channel, with new videos released every Wednesday and Saturday:

5 Ways To Invest In The Stock Market Using Leverage In The UK

Using debt to invest really does divide opinion. Personally, we think using other people’s money is a great tool at your deposal to grow your own wealth at a far faster pace than what otherwise would be possible.

In previous videos we’ve talked about some of the more easily understood ways you can use leverage to invest, such as extracting mortgage equity. In today’s post we will of course be briefly looking at this but we’re also going to introduce you to a few different ways to invest using leverage in the UK that I don’t think we’ve covered much before.

How to invest in the stock market using leverage in the UK! Let’s check it out…

If you’re looking to get a boost to your investments head over to the Money Unshackled Offers page where platforms like Freetrade, Trading 212, Stake and others are giving away free stocks and welcome bonuses when you sign up.

Alternatively Watch The YouTube Video > > >

Investing Is A Marathon – Not A Sprint

One of the biggest problems with investing is that for the average person who is able to make contributions of just a few hundred pounds each month, it takes a really long time for their investments to grow to a size where their assets can financially support their lifestyle.

In fact, for a typical person saving for retirement it might take 30-40 years from when they start contributing to when their investment pot becomes big enough to retire on. Waiting 40 years to become financially free is not acceptable to us. What about you?

So, why does it take so long? There are 3 things that dictate how much investments grow by: the amount invested, the time invested, and of course the investment returns.

Most of our amazing readers will be investing as much as they can, and they want financial freedom as soon as possible.  That leaves us with one choice. We must increase our rate of return and therein lies the problem.

All the evidence shows that most people cannot beat the market, so picking the next 100 bagger stock is unlikely. Most people are more likely to pick a stinker.

Therefore, we primarily invest in index funds and ETFs that aim to track the market instead. We would expect this to return around 8% per year, or 5% after inflation. The answer to our problem is that we need to supercharge that index return, and leverage is a very useful tool that might just help us do this.

What Is Leverage?

To quote Investopedia, “Leverage is the use of debt (borrowed capital) in order to undertake an investment or project. The result is to multiply the potential returns from a project. At the same time, leverage will also multiply the potential downside risk in case the investment does not pan out.”

That means if you invested say £1,000 of your own hard-earned money and earned 8%, you would make profit of £80. But had you invested £3,000 – with £2k coming from leverage, and only £1k of your own money, that 8% return would turn into 24%.

You’ve earned £240 profit on your investment of just £1,000. Amazing!

In practice using leverage would incur some small amount of interest payable to the lender, which would reduce that return ever so slightly, but you get the point!

Warning!

We can’t stress this enough – don’t use leverage unless you have lots of investing knowledge.

Even then, start slowly. We all have a tendency to be overconfident in our investing abilities. Lots of people can be great investors but when leverage is thrown into the mix, they start breaking their own rules and end up investing very poorly.

Remember, that all the benefits of leverage we just mentioned also work the opposite way. So, if we relook at that previous example of a 3x leveraged instrument, had the market fallen by 8% instead of risen, you would lose £240, which is a 24% loss.

The stock market is very volatile and can fall by more than 50% as it did between 2007 and 2009. If you were using the amount of leverage in our example you would have lost all of your own money.

5 Way To Invest In The Stock Market With Leverage

#1 – Leveraged ETFs

The popularity of Leveraged ETF’s has really ballooned in recent years. We now regularly see some in the top traded tables of UK platforms. In Q1 2021 the WisdomTree FTSE 100 3x Daily ETP (3UKL) was the 6th most popular buy on the Interactive Investor platform.

Leveraged ETFs are collective investment funds where lots of investor’s money is pooled together into one investment. They have been developed for short-term trading and therefore are said not to be suitable for long-term investors. They’re designed to multiply the short-term performance of an index or commodity. If we take the WisdomTree FTSE 100 3x Daily ETP as an example – this one is meant to provide three times the daily performance of the FTSE 100.

For example, if the FTSE 100 rises by 1% over a day, then the ETP will rise by 3%, excluding fees. However, if the FTSE 100 falls by 1% over a day, then the ETP will fall by 3%, excluding fees.

At first glance, leveraged ETFs look great. We know that in the long-term stock market indexes should go up, but when you delve a little deeper into leveraged ETFs, the numbers paint a very different picture.

What this financial instrument is not designed to do is to track the performance of the FTSE 100 over an extended period of time. That’s because leveraged ETFs reset daily to maintain the same leverage ratio – in this case 3x daily.

Hargreaves Lansdown had an interesting article on the subject and demonstrated the impact on returns for investors who hold leveraged ETFs for any longer than one day.

Fig.1: Example of a 3x leveraged ETF underperforming

On day one the normal ETF returns 10%, so the leveraged ETF returns 30%. Then the normal ETF drops by 10% the next day, so the leveraged ETF drops by 30%. As the days go on the leveraged ETF completely strays away from the benchmark index. In this example, the leveraged ETF has lost 17% but the normal ETF has barely moved.

If you’re trying to take advantage of short-term market movements these might be worth it.

#2 – Extract Equity From Your Mortgage

In the short-term the stock market is just as likely to be down as it is up, so short-term debt is very dangerous for use as leverage. Conversely, mortgages are one of the best ways to leverage stocks-based investments because a mortgage is a long-term source of debt. Your investments have 20, 30, or even 40 years to recover from any temporary setback. It’s very unlikely for the stock market to be down for such a long time.

How can you buy stocks with a mortgage, which are in fact loans intended for property purchases? Well, once you’ve paid down some of the outstanding mortgage on your home, or the property has gone up in value, you will be able to renegotiate your mortgage terms and extract equity in the form of extra mortgage debt.

This can then be used to buy and hold stocks, or preferably index funds, over the long-term.

A while back we calculated the optimal LTV at around 85%. Say your property was valued at £200k and your equity was worth £100k, you could take out £70k of additional long-term mortgage debt, which would leave £30k in equity and put you back on an 85% LTV.

You can now invest that £70k as you see fit (just don’t tell the bank). In effect you are using a mortgage to invest in the stock market. Just because society tells you to pay down your mortgage quickly, why should you? Better, we think, to grow your wealth with investments, and use the investment gains to pay off the mortgage later.

Another key benefit of using mortgages as your leverage source is that mortgages tend to be for a fixed term, so even if the stock market crashed (as long as you are meeting the monthly mortgage payments) the loan cannot be called in.

This is unlike most short-term debt offered on stock trading platforms, which could call in debts just when you’re at your lowest point.

#3 – Margin Loans

Margin loans are a form of secured lending offered by stockbroking platforms. The stockbroker uses the stocks & shares in the portfolio as security. The main drawback compared to a mortgage is that they are callable.

This means that if the value of the portfolio falls below a certain level, the broker will eventually sell some of your positions. They do this because the value of your collateral may have dropped to a level where the lender hasn’t got enough cover to protect them from you not repaying the loan.

Before selling your positions, the stockbroker should first serve you a margin call, which is essentially a demand for you to deposit more money. The problem is you are probably using margin because you don’t have the money or deliberately stretched yourself. If you did have the cash set aside to cover you for a margin call, there’s probably little point in paying to access the margin in the first place.

In the UK none of the major investing platforms offer margin accounts. In this respect, the UK is very different from the USA – where most reputable stockbrokers would offer margin.

Interactive Brokers seems to be the leading broker offering margin loans in the UK and are offering margin rates in GBP of around 1.5%. If you guys want us to review this service, let us know down in the comments. We’ll jump right on it if there’s enough demand.

Degiro is another broker that offers margin loans in the UK but the only others we’re aware of are private banks, which require hundreds of thousands or even millions of pounds to access.

#4 – Spread Betting / CFDs

Spread Betting and CFDs are similar, and both are definitely not for beginners. The main difference between the two is that Spread Betting is tax-free. Spread betting is illegal in many countries, so we are very fortunate in the UK as it’s legal here.

If you are an experienced investor, don’t let the term ‘betting’ put you off. It’s only considered betting because you are technically placing a ‘bet’ with a broker that the market will move one way or another, but it can be done in such a way that it’s very similar to normal investing if you understand it. You don’t actually own the underlying investment!

We have a big video planned on Spread Betting, where we’ll show you how we’re making big returns, so make sure you subscribe so you don’t miss it when we release it.

With Spread Betting you place a bet per point. Say you bet £10 per point on the S&P 500. If the S&P 500 moved from 4000 to 4200 you would have made £2,000 profit (200 points x £10).

Most spread betting firms will allow you to deposit just 5% (20 x leverage) of the overall exposure on indexes like the S&P 500, so in this example you could have made a 100% return on just a 5% gain in the index value.

Although this scenario is possible, we would encourage you to limit the amount of leverage you use at the beginning because if the financial instrument swings the wrong way you’ll lose a lot of money, very fast.

Spread Betting and CFDs get a bad rep because too many people try it without understanding how leverage works, and so naturally lose a boat load of cash. We’ll be going into a lot of detail in the soon to be released Spread Betting video, including what we’re investing in and what strategies we’re using, so keep an eye out for that.

#5 – 0% Credit Cards

0% credit cards can be used for a small amount of leverage, and they have a medium-term time horizon of around 2 years. I have used 0% purchase credit cards to spend on my normal day-to-day expenditure. But rather than paying down the full balance each month I would invest it instead. However, you must always make the minimum payment, or the credit card company will remove the 0% offer.

At the end of the 0% term, you can pay down the debt or use a 0% balance transfer credit card to move the debt to another card. We consider 0% credit cards to be a small, short-term advance, rather than a permanent leverage tool.

Should You Use Leverage?

If you have to ask this question, it’s probably best not to use leverage. It’s a high-risk strategy and should only be done by those who understand the risks and those who have the knowledge. Having said this, you learn to drive by driving, you learn to swim by swimming, and you learn to leverage… you get the point.

Where do you stand on using leverage to invest in the stock market? Join the conversation in the comments below.

Written by Andy

Featured image credit:  Andrey_Popov/Shutterstock.com

Also check out the MoneyUnshackled YouTube channel, with new videos released every Wednesday and Saturday:

Could A 1929-Style Stock Market Crash Happen Again Soon?

With stock markets continually hitting new highs and looking very overpriced, is it possible that the stock market could crash in a similar devastating fashion to what happened in 1929?

1929 was a long time ago and a lot has changed since then with protections, safeguards, and regulations put in place to prevent such an event ever happening again.

But as we saw in 2020, whole economies can fall apart almost overnight from something as seemingly insignificant as an infected bat.

Despite the steps taken, we think it is possible – no matter how unlikely any individual negative event is of happening – that any one could easily cause a severe stock market drop that could cause your life savings to vanish in a puff of smoke.

In this article we’re looking at the crash of 1929 and other major crashes in modern history. We’ll also look at the valuation of the S&P 500 to see if it is indeed in bubble territory.

Then we’ll take a look at the reasons why a mega crash could and couldn’t happen again, and we’ll finish up with some tips to protect your investments. Let’s check it out…

Commission-free trading platform Stake are giving away a free US stock worth up to $100 to everyone who signs up via our link. Be sure to check that out.

Alternatively Watch The YouTube Video > > >

What Happened In 1929?

Over 90 years ago the US stock market imploded! During the 1920s, the United States and Europe experienced strong economic growth, and the increase in industrial production saw stock prices on the New York Stock Exchange rise by approximately 300%.

But by September 1929 the market was to reach a peak that would not be surpassed for around 25 years. Imagine investing today and not seeing a return on your money for a quarter of a century – it seems unthinkable, but is it?

The selling intensified in October 1929 and signalled the beginning of the Great Depression. The crash was so severe that the worst days are known as “Black Thursday”, “Black Monday”, and “Black Tuesday”. Theres almost a black day for every day of the week.

The ‘Great Depression’ was a ten-year recession that impacted most westernised economies, and resulted in widespread poverty and unemployment.

Although 1929 is the year that is most talked about, it was around June 1932 which saw the bottom of the market. At that point the drop was around a terrifying 86%! That’s the equivalent of a £500,000 retirement pot collapsing to just £70,000 – your life savings completely obliterated.

The Great Depression and the associated bear market is commonly used as an example of how quickly and intensely the global economy can decline.

Today, many investors (us included) advocate buying more when stocks fall, and never selling – no matter how much the market falls by. If the market did ever repeat the 1932 drop, we doubt many of these investors would have the courage to stay the course. The recent Covid crash was just child’s play in comparison.

How Big Have Past Major Crashes Been?

The bear market that began in 1929 was the mother of all bear markets, but there have been other enormous crashes since.

This interesting graphic puts the major crashes into perspective. The covid crash was quite severe at 34% but it was over before anyone even noticed – lasting just 117 trading days.

The 2nd largest crash was the global financial crisis from 2007 to 2013 with a drop of 57%. The 2000 Dot Com bubble and the combined 1973 Nixon Shock and Opec Oil Embargo were equally devastating – with declines of 49% and 48% respectively and both lasting several years.

Although we often have to wait several years or even a few decades between crashes, large drops do happen on a semi-regular basis.

Based on the history, we think it’s fair to say that as a minimum we can expect drops in the region of 50% or more – we’ve seen three such occasions in the last 70 years. This raises the question: when will the next major crash happen?

Why Could The Stock Market Tank?

Future declines could be even worse than 1929 if triggered by a global war, a health crisis, major political upheaval, a natural disaster or other trauma.

Some possible events that immediately spring to mind include a war between China and the US, a pandemic that lays waste to populations, an asteroid that smashes into Earth, or a solar flare the likes of the Carrington Event in 1859, which would paint the night sky green and wipe out the electronics that the global economy now depends on.

If we had to bet on one event that is most likely it would be some sort of global hacking that cripples computer systems and brings our modern way of life to an abrupt halt. Imagine if we lost access to the internet.

It doesn’t matter how unlikely each individual event is. What matters is, if any one was to occur it could devastate the stock market and economies.

What’s more is that news, especially bad news, spreads faster than ever. An epic crash could not only be devastating but also swift.

S&P 500 Is Hitting New All-Time Highs

As you’ll no doubt be aware, the S&P 500 is hitting new highs all the time. If you’re living off your investments – maybe you’re a retiree or have achieved financial freedom already – then this is awesome and we’re massively jealous of you.

Unfortunately, for most of us who are accumulating wealth it means we are having to invest at potentially the top of the market. This means our money doesn’t go as far as we would like – we get less S&P 500 ETF shares for our money, and a crash or bear market is more likely to come along imminently.

All the studies, including our own research, says more times than not that you should invest as soon as you can. Don’t sit on cash and attempt to time the market, because in most cases the market continues to go up, even when it seems high. You may never get a better buying opportunity and you will miss out on massive growth.

We analysed the S&P 500 in great detail ourselves here to see what insights we could learn. It’s definitely worth checking that article out next.

The S&P 500 Price To Earnings Ratio

On its own the price of the S&P 500 doesn’t really tell us the full picture. To get a better understanding of just how expensive the market is we can look at the PE ratio.

S&P 500 is in a historic bubble according to the PE ratio

The chart above shows the S&P 500 Price to Earnings Ratio over the last 150 years. Presumably the data has been backdated somehow as the S&P 500 was first introduced in 1957. As we can see the current PE ratio is 44, making the index on this metric one of the most expensive times to buy in its history.

The PE ratio divides the price of the index by the reported earnings of each company for the trailing twelve months. It’s a good way to measure how much you are paying for current earnings. The lower the number the better.

Let’s take a look at the same chart but over 30 years to get a closer look:

The most recent 30 years

It seems that around 2009 the PE ratio went off the scales and was in extreme bubble territory. The data behind this chart put the PE ratio at 124. Without any context it might appear to be absurd to invest then. But in reality, it was one of best times to invest in a decade.

That point in time was near the stock market bottom after the 2007 financial crisis. In 2009 the trailing twelve-month earnings fell close to zero, which caused the PE ratio to get out of whack.

The S&P 500 CAPE Ratio

So, as we’ve seen the PE ratio is clearly not a great valuation metric when earnings are volatile. Therefore, a current PE ratio of 44 might not be as bad as it seems because over the past 12 months overall earnings have in many cases been decimated by Covid lockdowns. Airlines have practically been grounded and bars and restaurants had to shut up shop.

A solution to this PE ratio shortcoming is to divide the index price by the average inflation-adjusted earnings of the previous 10 years. This formula is called the Cyclically adjusted price-to-earnings ratio, commonly known as the CAPE ratio or Shiller PE ratio – named after it’s inventor Robert Shiller.

Using average earnings over the last decade helps to smooth out the impact of business cycles and other events and gives a better picture of a company’s sustainable earning power.

The CAPE ratio history also suggests we're in bubble territory

The chart above shows the CAPE ratio over the last 150 years. Just prior to Covid spooking the markets back in early 2020 the S&P 500 was already in extreme bubble territory. Since then, the market has continued to climb putting the CAPE ratio at 37.

Worryingly there has only ever been one period in 150 years when the CAPE ratio was higher. That was in the year 2000 at the height of the dot com bubble. That ended in pain as the market eventually tanked 49%. Arguably that sharp drawdown or decline was not even enough.

According to this chart it still left the S&P 500 in bubble territory, which is probably why for more than a decade from 2000 to around 2013 the S&P 500 pretty much went nowhere. It was over this time that earnings were given a chance to catch up with the lofty valuation.

The more expensive the CAPE ratio for the S&P 500 gets, the more likely we will eventually see a massive bear market.  Right now if the market crashed by 50% it would still be considered overvalued in historical terms. How scary is that!?

This demonstrates that there doesn’t even need to be anything fundamentally wrong in the economy for shock waves to flow through the stock market.

Reasons To Be Optimistic The Stock Market Will Never Repeat 1929

In 1929 the Federal Reserve was just 15 years old. The central bank’s members had no idea not only of what to do, but what they COULD do.

The Securities and Exchange Commission was set up as a result of the crash of 1929. Its mandate is to protect investors; maintain fair, orderly, and efficient markets; and facilitate capital formation. Better regulation should hopefully limit the size of crashes.

Social Security didn’t exist back then. When investors saw all of their money disappearing in front of their eyes and having no other means to survive you can understand why so many chose to flee and withdraw what little money they could. Today, social security schemes like furlough should protect people from the worst.

Asset protection schemes now exist in all major countries and are there to protect investors’ investments against platform and banking collapse. Here in the UK for instance we have the Financial Services Compensation Scheme and the US has something similar. Back in 1929 these did not exist.

We now have better information, better knowledge, and several decades of hindsight to learn from. We understand diversification more and have the means to do it.

An investor today can invest in almost every listed company in the world for a negligible fee. We can also invest across asset classes to minimise risk.

Earlier we saw the CAPE ratio near an all-time high. Robert Shiller, the economist behind the CAPE ratio, said in late 2020 that stock prices “may not be as absurd as some people think.”

He cited the effects of extremely low interest rates in making stocks attractive at higher prices, especially in comparison with bonds.

Top Tips To Protect Your Investments

If you are concerned about the S&P 500 being too frothy, then diversification is probably your best bet. The idea is that you build a portfolio of assets that are imperfectly correlated. When the S&P 500 goes down you might have another asset that falls less, or even goes up.

Government Bonds have a history of protecting portfolios when stock markets tank. The problem is nobody truly knows if that protection still stands true with interest rates being as low as they are.

Gold is another great way to diversify a portfolio. The incredible table below highlights why every portfolio should contain some exposure to the yellow metal. It shows some of the biggest S&P 500 crashes since 1976 and how gold and silver reacted. In 6 of the 8 periods gold was negatively correlated with stocks, so when stocks fell, gold actually increased in value. On most occasions, silver also fell alongside stocks but not to the same degree.

Gold usually moves oppositely to stocks during a crash

Gold’s only significant selloff (46% in the early 1980s) occurred just after its biggest bull market in modern history. Gold rose more than 2,300 percent from its low in 1970 to the 1980 peak. So it isn’t terribly surprising that it fell with the broader stock market at that point.

Cryptocurrency is the new kid on the block – after all, it has only existed for around 10 years. It might be too early to tell whether crypto can protect a portfolio in times of economic fear in the same fashion as gold. But it’s just another string to your bow.

If you’re looking for more unusual asset classes, which in many cases have no correlation with stocks, then check out our article on alternatives next. In it we look at how you can grow your wealth in a multitude of different investments including song royalties, whisky, and even livestock.

And finally, not all stocks have the same level of risk. A pioneering pharmaceutical company looking to cure cancer is riskier than a dependable utility company that provides clean water and sewage treatment. If you fear a crash, move to slightly safer stocks.

Do you think we will see another crash of 86% ever again? And what’s most likely to cause it? Join the conversation in the comments below.

Written by Andy


Featured image credit: Rawpixel.com/Shutterstock.com

Also check out the MoneyUnshackled YouTube channel, with new videos released every Wednesday and Saturday:

Just One Fund – Is The S&P 500 All You Need?

S&P 500 vs global diversification. Which is right for your investment portfolio? Which will perform best?  Is it crazy to invest your entire equity allocation in just one country, and does the increased costs of wider diversification outweigh the benefits?

We’re wondering what would happen if we scrapped the global approach and just went with a low-cost, top performing US ETF. That’s what we’re finding out today.

If you’re looking for the best place to invest, then check out our handpicked favourite investment platforms here. Also, don’t forget to check out the Offers page where you can grab free stocks with Freetrade and 25% off Stockopedia, plus many more.

Alternatively Watch The YouTube Video > > >

Why Are We Considering This Now?

When I first started investing properly around a decade ago most of the literature and information sources were heavily biased towards investing in the UK market. Even to this day there’s still far too much emphasis from the media on investing in our home market. FYI, the UK only makes up around 4% of global market cap, so it makes no sense to put all your wealth there.

It took me years to wean myself off this UK focus, and now as our regular viewers will know both Ben and I invest in stocks from all around the world. This wide diversification and global stance is probably what the UK FIRE community advocates most.

However, a lot of Americans only invest in US stocks, particularly the S&P 500, and they do alright. We always put this down to the same sort of home bias that we used to demonstrate ourselves, but one they could get away with as the US stock market and USD dollar is so dominating. 57% of the FTSE ALL-World index is comprised of US stocks.

Also, investing gurus like Warren Buffett have reinforced the idea that the S&P 500 is all you need as he has instructed the trustee in charge of his estate to invest 90 percent of his money into the S&P 500 and 10% into government bonds for his wife after he dies.

For index investors there’s really not that much you need to do, other than invest as much you can and wait for time and compounding to work its magic. We spend most of our efforts on strategies to minimise fees and taxes, so we capture as much of the index returns as possible. In other words, what we’re attempting to do is track the REAL index as closely as we can.

What we’ve learnt is that this is much easier to do with certain indexes like the S&P 500 than it is with others, such as global indexes. So, this raises the question: is it worth paying extra for global diversification… or is the S&P 500 all you need?

What Is The S&P 500?

If you’re considering investing solely in the S&P 500 then we should definitely take a look at exactly what it is first.

The S&P 500 index contains the majority of the biggest and best companies domiciled in the US. The word “domiciled” is key, and we’ll come back to this. The S&P 500 is considered to be one of the best single gauges for the U.S. equity market, and the index captures approximately 82% of the total U.S. equity market value – practically all of it.

It is a market-cap-weighted stock market index, effectively meaning the largest companies make up a larger slice of the index. Everyone will be familiar with the top holdings as it includes huge companies like, Apple, Microsoft, Amazon, Google’s parent company Alphabet, Buffett’s Berkshire Hathaway, and so many more behemoths.

Recently it has become known for its large technology exposure with most of the top holdings being tech giants.

S&P 500 Returns vs The World

We’ve seen some people wrongly assume that the S&P 500’s incredible returns and outperformance over the last few years will continue. Basing investing decisions on historical performance of just a few years is probably madness, but how many years do we need to look over before that madness becomes a long-term trend – potentially signifying a long-lasting advantage?

We decided to compare 51 years of total return data – which was the max we could get – to see how the S&P 500 stacks up against the MSCI world index.

The MSCI world index is an index comprising of 23 developed markets and covers 85% of the market cap of each country.

In annual terms the difference was fairly close, with the world index returning 9.8% vs 10.7% for the S&P 500. But in total terms, that’s a huge difference. $100 invested in the world index would be worth $11,625 vs. $18,197 for the S&P 500 – that’s 56% more!

Bear in mind that as of now, US stocks make up 67% of the MSCI world index, so for the S&P to outperform it by such a large margin, would suggest that US stocks absolutely annihilated the non-US stocks within the world index.

Of course, there’s no guarantee that history will repeat itself, but we think there’s something about the United States that gives its companies a sustained competitive advantage.

Despite this long-term outperformance, there’s something reassuring about the wider diversification achieved by investing in global markets. For the sake of argument let’s assume that we’re all happy to sacrifice that extra potential return. How much is that extra diversification worth paying for?

The Real Cost of Tracking An Index

As we mentioned, the world index returned 9.8% per year and the S&P 500 returned 10.7% per year. Fantastic, but we can’t actually get those returns because there are fees and taxes that will massively drag on what we get to take home.

We think most investors are aware that fees and taxes exist but don’t really understand their magnitude. We hope that what we’re about to show you will shine a light on these unwelcome performance headwinds, and help you organise your investments to maximise after-tax and after-fee returns.

Our favourite investment tool is the ETF, and the most common way to compare ETF costs is with the Ongoing Charges Figure or OCF. OCF’s are extremely useful to get an idea of costs but they too are not fool proof.

Tracking difference is a much better gauge of the true cost but even that has its limitations. Tracking difference is the difference between the returns of the fund and the target index. Unfortunately, all ETF and fund providers mislead their investors about which index they should be benchmarked against.

For example, it would be reasonable to assume that an S&P 500 ETF tracks the S&P 500 total return index, but you’d be wrong. They all track the S&P 500 NET Total Return index, which has a deduction for 30% withholding tax – even though no sensible UK investor would ever pay this much.

VUSA performance

A quick glance at the performance chart of an ETF would lead you to think that you were beating the index, when the reality is you are most definitely not!

The best way to calculate your ETF costs (and taxes) is going to require a little work. We’ve gone ahead and done this for the ETFs that we like to invest in and a few other popular ones, so we can compare and refine our investment strategy.

We’re comparing the actual index total returns – commonly known as gross returns – and comparing them to the actual returns of the ETF. The difference we’re calling the Real Tracking Difference.

The Real Tracking Difference

MSCI World Total Returns

What we’re looking at here is the actual returns of the MSCI World index over the last few years. We’ve then benchmarked it against the iShares ETF, which is the most popular ETF tracking this specific index. Despite it only having an OCF of 0.20%, it is on average under hitting the index by -0.55% every year.

The Invesco ETF, which is synthetic, does a better job because it avoids certain withholding taxes, but still under performs the index by an average of -0.44% per year.

FTSE All-World Total Returns

A not too dissimilar index is the FTSE All-World that Vanguard’s VWRL ETF tracks. Shockingly, the Real Tracking Difference for this ETF is -0.59% per year on average.

What this means is if you are tracking global stock markets you are not actually achieving the returns you might have thought you were.

The next question is: how close to the index can we get with an S&P 500 ETF? For a start, the OCFs are much lower. The Invesco ETF is as low as 0.05% and iShares and Vanguard are both 0.07%.

S&P 500 Total Returns

When we benchmark these with the actual S&P 500 total return index, we see that both iShares and Vanguard still have Real Tracking Differences of -0.40% and -0.41% respectively. Not great but noticeably lower than the world alternatives.

Moreover, it is possible to get that Real Tracking Difference down to practically nothing with a synthetic ETF. The Invesco ETF does exactly that – under hitting the index by just -0.10% per year on average.

The best MSCI World tracker misses the target by -0.44% and the best S&P 500 tracker just misses it by -0.10%. That means the World Index would have to outperform the S&P 500 by 0.34% every year just to match its returns. An outperformance of this size seems highly unlikely mathematically considering that 67% of that index is comprised of US stocks.

When we add in the tracking difference to the historical index returns, the world index returned 9.3% vs 10.6% for the S&P 500. Over the 51 years, the total difference is now even greater. $100 invested in the world index would be worth $9,472 vs. $17,377 for the S&P 500 – that’s 83% more!

Tighter Spreads

The cost benefits for the S&P 500 don’t stop there. The ETFs tracking the S&P are much bigger in terms of assets under management and have much more volume passing through them, which means the spreads are far tighter.

When you buy a stock or an ETF the buy price is higher than the sell price. It’s what’s known as the bid-offer spread. The more liquid an ETF is the tighter that spread will be, which is precisely what you want.

Indicative spreads

Again, we compared the spreads for a bunch of ETFs and the S&P 500 ETFs were cheap as chips. Their spreads were 0.03% which is practically non-existent. Although the other ETFs we were comparing to were also cheap there spreads were large enough to think twice about frequently trading in and out of them.

Qualitative Factors

#1 – Diversification

Investments should not be chosen just on the potential return – risk should also be considered. The main reason beyond this cost analysis to still invest globally is diversification – not putting all your eggs in one basket.

However, the counter argument to that is that although the S&P 500 is just US domiciled stocks, they are in fact global companies that just so happen to be based in the US. 29% of their revenues come from foreign markets.

Also, the S&P 500 has an increasingly growing concentration risk. The top 10 components make up 26% of the entire index. That’s a lot of exposure to just a handful of companies. Adding in stocks from around the world helps to dilute this.

#2 – Follow The Leader

A qualitative argument for just investing in the S&P 500 is that the US market dictates what happens everywhere else. In this interconnected world it would be unthinkable for the US to suffer a recession and Europe to be cruising along at the same time.

In fact, this can be seen in the behaviour of the UK stock market. In any given day it might be performing well, but as soon as negative news comes flooding in from the US this can be turned on its head in an instant.

#3 – Blurring The Lines Between Active And Passive

One potentially important point to note is that there are certain eligibility requirements to be included in the S&P 500 and a committee ultimately has the final say, which is why a giant like Tesla was only recently included despite being one of the most valuable companies on the planet.

Excluding certain stocks in this manner is dangerously close to active management, which is fine if you want that but a red flag if you don’t. World indexes are much more reliant on a rules-based approach.

#4 – The US Is A Safe Haven

This probably won’t last forever but for several decades the US and the US dollar have been a safe haven. When markets were tanking in 2020 during the Covid crash, investors rushed to the US dollar. So, as the S&P fell in dollar terms, the impact was softened by the increasing value of the dollar against the pound – meaning UK investors holding wealth in the S&P were affected less than what they could have been.

How Are We Responding To This?

We’re generally undecided. Changing how you think is not easy and takes a while – think of it like an oil tanker turning.

Also, when everyone else is saying you need global diversification it’s difficult to go against the grain. We fully agree with the benefits of diversification but is the additional cost worth it?

What do you think? Is the S&P 500 all you need? Join the conversation in the comments below.

Written by Andy


Featured image credit: Immersion Imagery/Shutterstock.com

Also check out the MoneyUnshackled YouTube channel, with new videos released every Wednesday and Saturday:

Top 3 Dividend Stocks For Summer 2021 (Trading 212 Dividend Pie Update)

Now that things have settled down a bit in the economy, we can see more clearly through the fog of uncertainty with regards to dividend stocks. What are the best dividend stocks to buy this summer for long term stability, yield and growth?

Back in February, we put on our analyst hats and used a set of rules and data to automatically select 20 dividend stocks while removing the human element from the decision – and it’s done great!

It’s well documented that institutional stock pickers underperform indexes 85% of the time. The thinking was to remove our instincts to second-guess which dividend stocks will and won’t do well, by building a portfolio of dividend stocks using rules.

We’ll show you how well the dividend portfolio performed, and the essential changes we’ve just made to the portfolio for Summer 2021.

We also go on to single out from this pool of rules-based stock picks what we think are the 3 best placed dividend stocks to outperform over the next year. Let’s check it out!

Our dividend stock portfolio was made possible by the innovative investing solutions offered by Stockopedia and Trading 212. Get a free stock worth up to £100 when you open an account with Trading212 (at time of writing there’s a waiting list you can join which secures your free stock), and 25% off a Stockopedia subscription after a 2-week free trial. Don’t miss out.

Alternatively Watch The YouTube Video > > >

You can find our updated dividend stocks Pie on Trading 212 here.

The MU Dividend Aristocrats Pie

We originally built this portfolio on the Trading 212 app, specifically chosen because of their awesome Pies feature, which lets you build a portfolio of stocks with specified percentage allocations.

The app lets you invest on a percentage basis as much as you want into each stock or ETF in your Pie.

We chose 20 stocks, equally weighted at 5% each. Their values of course drifted over time, but today we’ll be resetting the pie back to 20 stocks at 5% each. This is super easy to do, and we’ll show you exactly what we did in a moment.

The methodology we followed is fully documented in our previous episode/article, linked here.

But briefly, we cross analysed the best dividend stocks as per Stockopedia’s StockRanks, with the best stocks according to the S&P Global Dividend Aristocrats Quality Income Index, which in our view is the ultimate index for dividend stocks. The top ranking 20 from our model made the cut into the Pie.

MU Dividend Pie: The Last 3 Months

When we built this dividend pie 3 months ago, we dropped £1,000 into it as an experiment to see how well this approach would work. Performance since inception has been fantastic, with total returns of 12.51% in just 3 months.

1.00% of that came from dividends, and the other 11.51% from share price growth. We had set the app to reinvest dividends, but it looks like the pound amounts were too low for this function to kick in. Returns would therefore have been marginally higher if we’d invested more money.

We got 15 dividend payments over the period – some of the stocks pay dividends twice yearly, some quarterly, and so on.

Some of the individual stocks did amazing, with 4 returning around 30% and several others with really good hauls. 4 performed negatively, but only 2 did really bad. Watch the video version of this article for more details.

How does our return of 12.51% compare to a benchmark? The best benchmark to use for comparison is the returns on the SPDR S&P Global Dividend Aristocrats UCITS ETF (GBDV).

This ETF tracks the index that we are selecting stocks from, and the returns are what you could really have gotten if you had bought this ETF instead back in February.

The growth in the ETF price plus the quarterly dividend distribution paid in early May would have given you a total return of 10.41%. Our Pie has returned 2.10% better than this, at 12.51%! So, we managed to achieve what we set out to – we beat the index. For now at least!

Now We Need To Rebalance

A lot can change in 3 months. Especially as we’re coming out of one of the biggest periods of uncertainty for dividend stocks. After the markets crashed in 2020, cash flows became tight, and many companies had to cut or cancel their dividends.

But not any of our champion stocks. Below is how the Pie stood at inception – now 3 months later, 6 have to go. Not because they couldn’t survive the pandemic (all remain in the Dividend Aristocrats index), but because even better stocks have come along to take their place.

The Pie when it started (3 months ago), showing today's cuts

2 had to go because we only allow 5 stocks from any one sector in the Pie – it’s one of our rules to ensure we get adequate diversification – and there were 5 Financials that ranked higher than these this time around.

The others’ Stock Ranks fell out of the Top 20 this time around. These 6 will be cut, despite some of them doing ace – People’s United grew 20% and United Bankshares grew 14%. Verizon, Moneysupermarket and B&G Foods all did poorly over the quarter and are amongst the cuts.

But the main reason we’re having to swap as many as 6 stocks out on this rebalance is that, as we’ll soon see, Trading 212 recently massively updated their available range to now include almost all of the Dividend Aristocrat stocks from the US, UK and Europe. 5 of the 6 replacement stocks were not available back in February.

If they had been, this rebalance would be a lot smaller. For this reason, we’re not overly concerned about the temporary increased impact of transaction fees from FX, Bid-Offer Spreads, and Stamp Duty.

The Updated Pie

The updated Pie, showing today's additions

Here’s the details of the new Pie, updated as of the end of May 2021. This is what the data and algorithms are telling us are the best dividend stocks for Summer 2021.

The process has added 6 new stocks, 5 of which are due to Trading 212 adding them to their available range since we last carried out this exercise, and Exxon Mobil because it has staged a miraculous comeback from a prior Stock Rank of 50.

Most of the other stocks are more or less where they were 3 months ago, but with big improvements in Stock Rank for Pfizer and Swisscom.

We added the 6 new stocks into the Pie on Trading 212 at 5% weightings, removed the 6 that our data is telling us must now to be dropped, and rebalanced the whole Pie back to equal 5% weightings for all stocks. This also redistributes our existing gains amongst the new mix of stocks.

You can find our updated dividend stocks Pie on Trading 212 here. Feel free to copy it or to use it as inspiration for your own portfolio. If you previously copied the original Pie you will have to use the new link as we will be closing the old version.

Top 3 Dividend Stocks For Summer 2021

If you don’t fancy building an entire portfolio using rules, then we’ve hand-picked our Top 3 Dividend Stocks for Summer 2021 from within the MU Dividend Aristocrats Pie.

That’s because we know that these stocks:

[a] – all have 10-year consecutive records of maintaining or increasing their dividends, courtesy of being on the Dividend Aristocrats index;

[b] – all are ranked highly by Stockopedia for the overall average of their Value, Quality and Momentum; and

[c] – are all available on Trading 212, and hence anyone can trade these stocks without having to pay commissions.

See the video above for a full walkthrough of these stocks on Stockopedia.

Top Dividend Stock #1 – Janus Henderson Group

Being top of the list in terms of Stock Rank, the fact that this Dividend Aristocrat was excluded from the Trading 212 available range until only recently is, in our view, almost criminal.

It is the best rated stock from the Financials sector in a Pie where 5 of the top 9 entries are Financials. The sector, known for its value stocks, is making a big comeback after covid.

Janus Henderson is an independent global investment manager, focusing on the United States, Europe, Asia and Australia.

It scores amazingly in Stockopedia across all ranking areas. At a market cap the equivalent of just £4.6bn it has plenty of scope for growth. Its forward PE ratio looks very tempting at just 10.5, suggesting this US company is valued on the cheap side, both within the market as a whole and within the finance industry.

Its growth momentum over the last year gives it the feel of a growth stock, but it’s a strong dividend payer too with a forecast yield of 4.0%.

It qualifies for 4 Stockopedia Long Screens, which is impressive – more screens means more ways by which it is considered a good stock and likely to get the attention of other investors. That puts them in the top 350 stocks by screens of the 19,000+ US, UK and European stocks that we have access to with our Stockopedia memberships.

Its revenue and profits are forecast to grow, as are its dividend per share and dividend yield. And there’s a big sign of safety – negative debt. This means the company has more cash than debt, which means it has fantastic liquidity. After poring through their accounts we can also confirm that they have negative debt after excluding ring-fenced client cash.

Want a dividend aristocrat stock with growth potential, which ticks all the right boxes? Then look at Janus Henderson Group.

Top Dividend Stock #2 – Exxon Mobil

The pandemic took a hammer blow to the Oil industry, but the story of 2021 so far has been one of recovery. As the world opens up again, oil is once again going to be needed.

That said, investing in the old energy companies is still a contrarian position to take.

A play on Oil is a bet that the harsh economic reality of going green will come home to roost, and the switch away from fossil fuels will take longer than wished for by the global elite.

One good thing about investing in an old-fashioned energy company is that you’re not investing directly in a commodity like Oil.

Rather, you’re investing in a multinational operation stuffed full of cash, patents, and research scientists; and you can bet your bottom dollar they won’t be sitting around meekly waiting to become redundant.

They might be the companies who lead the market in the energy technologies of the future, like hydrogen and fusion.

Back to Exxon then, what’s so good about this stock in particular?

Despite being one of the worst effected industries by covid, Exxon maintained its dividend payments throughout the pandemic, despite fears that it would have to cut them.

Exxon didn’t make it into the Pie back in February because it was rated terribly at just 50 out of 100. Since then, it has shot up to a ranking of 88, meaning fears for this stock may have been misplaced.

If you’re looking for price growth potential, it’s still there in spades in the oil industry, and Exxon has a strong run of momentum in price growth since October 2020.

Revenue is forecast to return to strength in 2021 and 2022. It increased its debt throughout the pandemic, but only to 3x its 2018 profits – not yet a red flag issue.

With a yield touching 6%, this is a consistent dividend payer that’s cheap to own, and unloved as a stock due to the negative press around the industry.

If you feel you can ignore the peacock feathers of the clean energy industry and the showboating politicians, you might find you can get a few more years of value out of Exxon Mobil.

Top Dividend Stock #3 – Pfizer

If Exxon Mobil had a rough pandemic, Pfizer has found a lot to be cheerful about.

The Pfizer vaccine was the first on the scene at the end of 2020, and has led the way in the US, UK, Europe, and elsewhere in the world as the vaccine of choice.

Pfizer has so far managed to avoid controversies on the scale of those which have dogged AstraZeneca, and their brand and profile have been vastly improved by being perceived as heroes of the pandemic.

If you search Google Trends for the word “Pfizer”, you’ll see its journey from a non-entity to a household name since the end of 2020.

Pfizer are ranked very high in Stockopedia for Quality, reflecting their stability as an established pharmaceutical giant with a market cap the equivalent of £152bn.

Revenue and profits are forecast to be up massively in 2021 and 2022, obviously a result of its recent success with the vaccine. Its dividend per share and dividend yield are increasing and this is forecast to continue.

Sales have grown 44% in the last year, but that can be put down to the vaccine rollout. The real question is, will Pfizer’s success continue in the post-pandemic era?

We think it will. People will remember Pfizer’s role in this pandemic, and so long as the vaccines don’t cause long-term side effects, Pfizer’s brand should retain a permanent boost.

They are well placed to take advantage of a world that now cares a lot more about virus control.

What do you think of the stocks in the Money Unshackled Dividend Pie? Will you be investing? Join the conversation in the comments below.

Written by Ben

Featured image credit: jittawit21/Shutterstock.com

Also check out the MoneyUnshackled YouTube channel, with new videos released every Wednesday and Saturday: