

With stock markets continually hitting new highs and looking very overpriced, is it possible that the stock market could crash in a similar devastating fashion to what happened in 1929?
1929 was a long time ago and a lot has changed since then with protections, safeguards, and regulations put in place to prevent such an event ever happening again.
But as we saw in 2020, whole economies can fall apart almost overnight from something as seemingly insignificant as an infected bat.
Despite the steps taken, we think it is possible – no matter how unlikely any individual negative event is of happening – that any one could easily cause a severe stock market drop that could cause your life savings to vanish in a puff of smoke.
In this article we’re looking at the crash of 1929 and other major crashes in modern history. We’ll also look at the valuation of the S&P 500 to see if it is indeed in bubble territory.
Then we’ll take a look at the reasons why a mega crash could and couldn’t happen again, and we’ll finish up with some tips to protect your investments. Let’s check it out…
Commission-free trading platform Stake are giving away a free US stock worth up to $100 to everyone who signs up via our link. Be sure to check that out.
Alternatively Watch The YouTube Video > > >
What Happened In 1929?
Over 90 years ago the US stock market imploded! During the 1920s, the United States and Europe experienced strong economic growth, and the increase in industrial production saw stock prices on the New York Stock Exchange rise by approximately 300%.
But by September 1929 the market was to reach a peak that would not be surpassed for around 25 years. Imagine investing today and not seeing a return on your money for a quarter of a century – it seems unthinkable, but is it?
The selling intensified in October 1929 and signalled the beginning of the Great Depression. The crash was so severe that the worst days are known as “Black Thursday”, “Black Monday”, and “Black Tuesday”. Theres almost a black day for every day of the week.
The ‘Great Depression’ was a ten-year recession that impacted most westernised economies, and resulted in widespread poverty and unemployment.
Although 1929 is the year that is most talked about, it was around June 1932 which saw the bottom of the market. At that point the drop was around a terrifying 86%! That’s the equivalent of a £500,000 retirement pot collapsing to just £70,000 – your life savings completely obliterated.
The Great Depression and the associated bear market is commonly used as an example of how quickly and intensely the global economy can decline.
Today, many investors (us included) advocate buying more when stocks fall, and never selling – no matter how much the market falls by. If the market did ever repeat the 1932 drop, we doubt many of these investors would have the courage to stay the course. The recent Covid crash was just child’s play in comparison.
How Big Have Past Major Crashes Been?
The bear market that began in 1929 was the mother of all bear markets, but there have been other enormous crashes since.
This interesting graphic puts the major crashes into perspective. The covid crash was quite severe at 34% but it was over before anyone even noticed – lasting just 117 trading days.
The 2nd largest crash was the global financial crisis from 2007 to 2013 with a drop of 57%. The 2000 Dot Com bubble and the combined 1973 Nixon Shock and Opec Oil Embargo were equally devastating – with declines of 49% and 48% respectively and both lasting several years.
Although we often have to wait several years or even a few decades between crashes, large drops do happen on a semi-regular basis.
Based on the history, we think it’s fair to say that as a minimum we can expect drops in the region of 50% or more – we’ve seen three such occasions in the last 70 years. This raises the question: when will the next major crash happen?
Why Could The Stock Market Tank?
Future declines could be even worse than 1929 if triggered by a global war, a health crisis, major political upheaval, a natural disaster or other trauma.
Some possible events that immediately spring to mind include a war between China and the US, a pandemic that lays waste to populations, an asteroid that smashes into Earth, or a solar flare the likes of the Carrington Event in 1859, which would paint the night sky green and wipe out the electronics that the global economy now depends on.
If we had to bet on one event that is most likely it would be some sort of global hacking that cripples computer systems and brings our modern way of life to an abrupt halt. Imagine if we lost access to the internet.
It doesn’t matter how unlikely each individual event is. What matters is, if any one was to occur it could devastate the stock market and economies.
What’s more is that news, especially bad news, spreads faster than ever. An epic crash could not only be devastating but also swift.
S&P 500 Is Hitting New All-Time Highs
As you’ll no doubt be aware, the S&P 500 is hitting new highs all the time. If you’re living off your investments – maybe you’re a retiree or have achieved financial freedom already – then this is awesome and we’re massively jealous of you.
Unfortunately, for most of us who are accumulating wealth it means we are having to invest at potentially the top of the market. This means our money doesn’t go as far as we would like – we get less S&P 500 ETF shares for our money, and a crash or bear market is more likely to come along imminently.
All the studies, including our own research, says more times than not that you should invest as soon as you can. Don’t sit on cash and attempt to time the market, because in most cases the market continues to go up, even when it seems high. You may never get a better buying opportunity and you will miss out on massive growth.
We analysed the S&P 500 in great detail ourselves here to see what insights we could learn. It’s definitely worth checking that article out next.
The S&P 500 Price To Earnings Ratio
On its own the price of the S&P 500 doesn’t really tell us the full picture. To get a better understanding of just how expensive the market is we can look at the PE ratio.
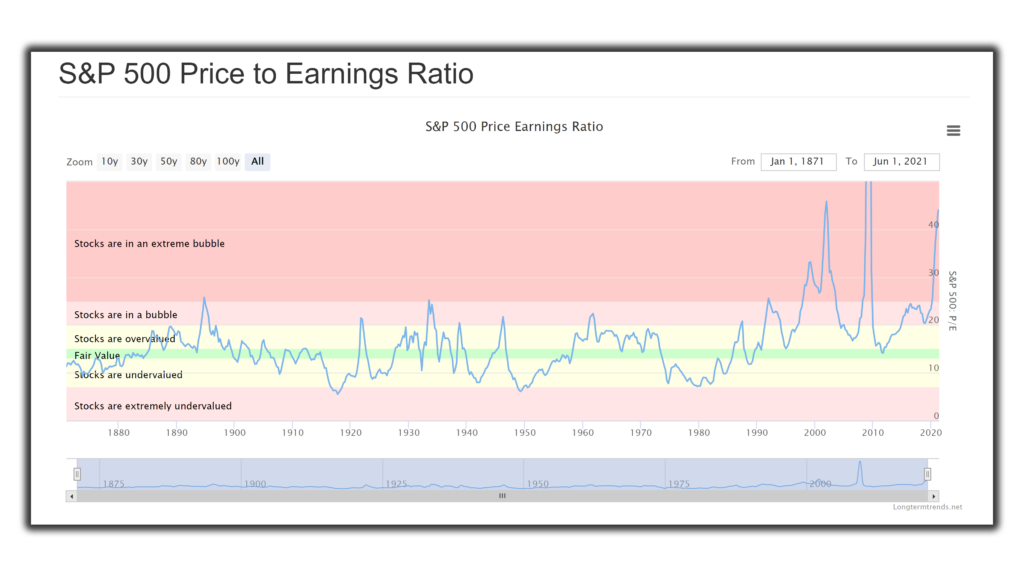
The chart above shows the S&P 500 Price to Earnings Ratio over the last 150 years. Presumably the data has been backdated somehow as the S&P 500 was first introduced in 1957. As we can see the current PE ratio is 44, making the index on this metric one of the most expensive times to buy in its history.
The PE ratio divides the price of the index by the reported earnings of each company for the trailing twelve months. It’s a good way to measure how much you are paying for current earnings. The lower the number the better.
Let’s take a look at the same chart but over 30 years to get a closer look:
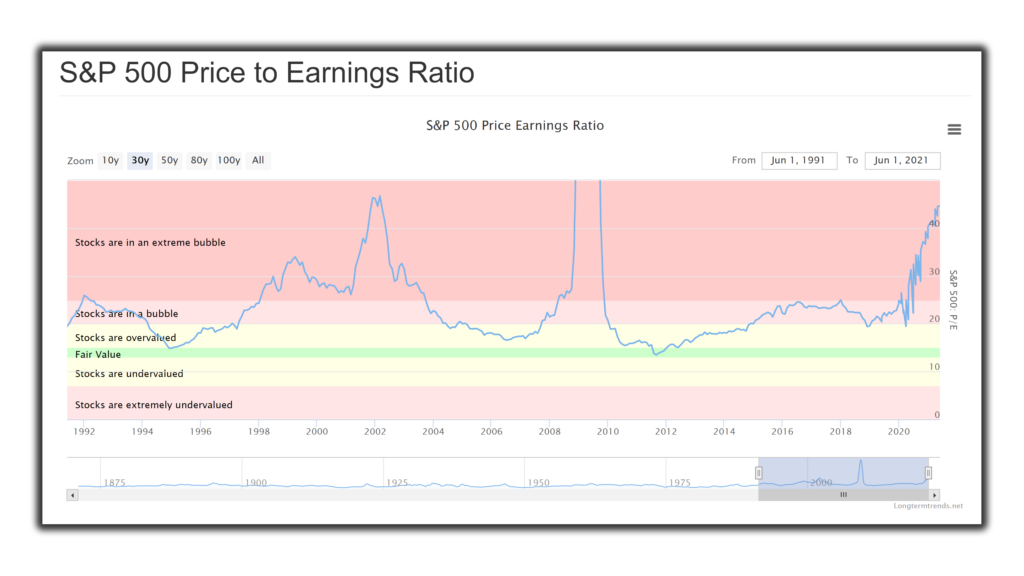
It seems that around 2009 the PE ratio went off the scales and was in extreme bubble territory. The data behind this chart put the PE ratio at 124. Without any context it might appear to be absurd to invest then. But in reality, it was one of best times to invest in a decade.
That point in time was near the stock market bottom after the 2007 financial crisis. In 2009 the trailing twelve-month earnings fell close to zero, which caused the PE ratio to get out of whack.
The S&P 500 CAPE Ratio
So, as we’ve seen the PE ratio is clearly not a great valuation metric when earnings are volatile. Therefore, a current PE ratio of 44 might not be as bad as it seems because over the past 12 months overall earnings have in many cases been decimated by Covid lockdowns. Airlines have practically been grounded and bars and restaurants had to shut up shop.
A solution to this PE ratio shortcoming is to divide the index price by the average inflation-adjusted earnings of the previous 10 years. This formula is called the Cyclically adjusted price-to-earnings ratio, commonly known as the CAPE ratio or Shiller PE ratio – named after it’s inventor Robert Shiller.
Using average earnings over the last decade helps to smooth out the impact of business cycles and other events and gives a better picture of a company’s sustainable earning power.
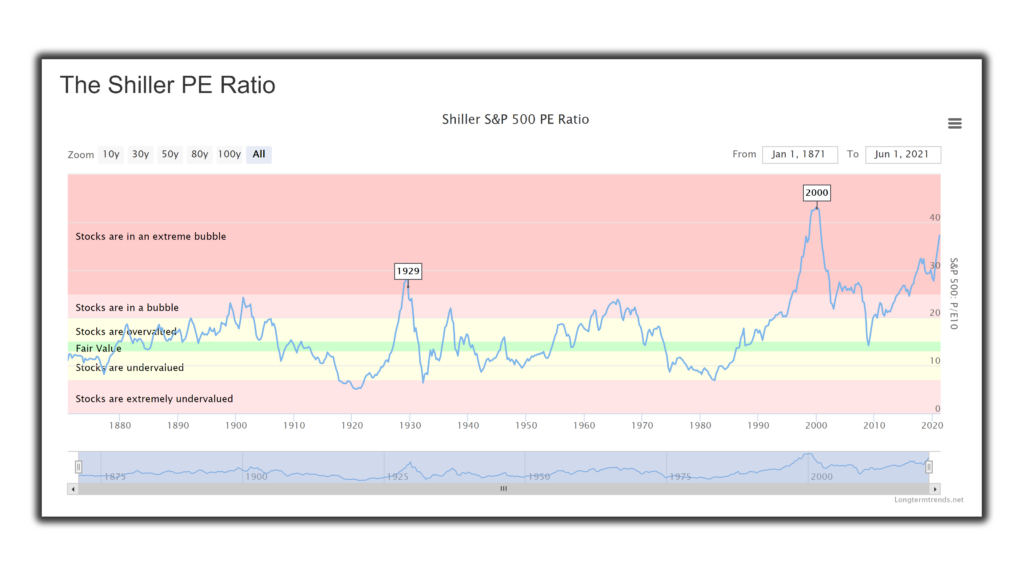
The chart above shows the CAPE ratio over the last 150 years. Just prior to Covid spooking the markets back in early 2020 the S&P 500 was already in extreme bubble territory. Since then, the market has continued to climb putting the CAPE ratio at 37.
Worryingly there has only ever been one period in 150 years when the CAPE ratio was higher. That was in the year 2000 at the height of the dot com bubble. That ended in pain as the market eventually tanked 49%. Arguably that sharp drawdown or decline was not even enough.
According to this chart it still left the S&P 500 in bubble territory, which is probably why for more than a decade from 2000 to around 2013 the S&P 500 pretty much went nowhere. It was over this time that earnings were given a chance to catch up with the lofty valuation.
The more expensive the CAPE ratio for the S&P 500 gets, the more likely we will eventually see a massive bear market. Right now if the market crashed by 50% it would still be considered overvalued in historical terms. How scary is that!?
This demonstrates that there doesn’t even need to be anything fundamentally wrong in the economy for shock waves to flow through the stock market.
Reasons To Be Optimistic The Stock Market Will Never Repeat 1929
In 1929 the Federal Reserve was just 15 years old. The central bank’s members had no idea not only of what to do, but what they COULD do.
The Securities and Exchange Commission was set up as a result of the crash of 1929. Its mandate is to protect investors; maintain fair, orderly, and efficient markets; and facilitate capital formation. Better regulation should hopefully limit the size of crashes.
Social Security didn’t exist back then. When investors saw all of their money disappearing in front of their eyes and having no other means to survive you can understand why so many chose to flee and withdraw what little money they could. Today, social security schemes like furlough should protect people from the worst.
Asset protection schemes now exist in all major countries and are there to protect investors’ investments against platform and banking collapse. Here in the UK for instance we have the Financial Services Compensation Scheme and the US has something similar. Back in 1929 these did not exist.
We now have better information, better knowledge, and several decades of hindsight to learn from. We understand diversification more and have the means to do it.
An investor today can invest in almost every listed company in the world for a negligible fee. We can also invest across asset classes to minimise risk.
Earlier we saw the CAPE ratio near an all-time high. Robert Shiller, the economist behind the CAPE ratio, said in late 2020 that stock prices “may not be as absurd as some people think.”
He cited the effects of extremely low interest rates in making stocks attractive at higher prices, especially in comparison with bonds.
Top Tips To Protect Your Investments
If you are concerned about the S&P 500 being too frothy, then diversification is probably your best bet. The idea is that you build a portfolio of assets that are imperfectly correlated. When the S&P 500 goes down you might have another asset that falls less, or even goes up.
Government Bonds have a history of protecting portfolios when stock markets tank. The problem is nobody truly knows if that protection still stands true with interest rates being as low as they are.
Gold is another great way to diversify a portfolio. The incredible table below highlights why every portfolio should contain some exposure to the yellow metal. It shows some of the biggest S&P 500 crashes since 1976 and how gold and silver reacted. In 6 of the 8 periods gold was negatively correlated with stocks, so when stocks fell, gold actually increased in value. On most occasions, silver also fell alongside stocks but not to the same degree.
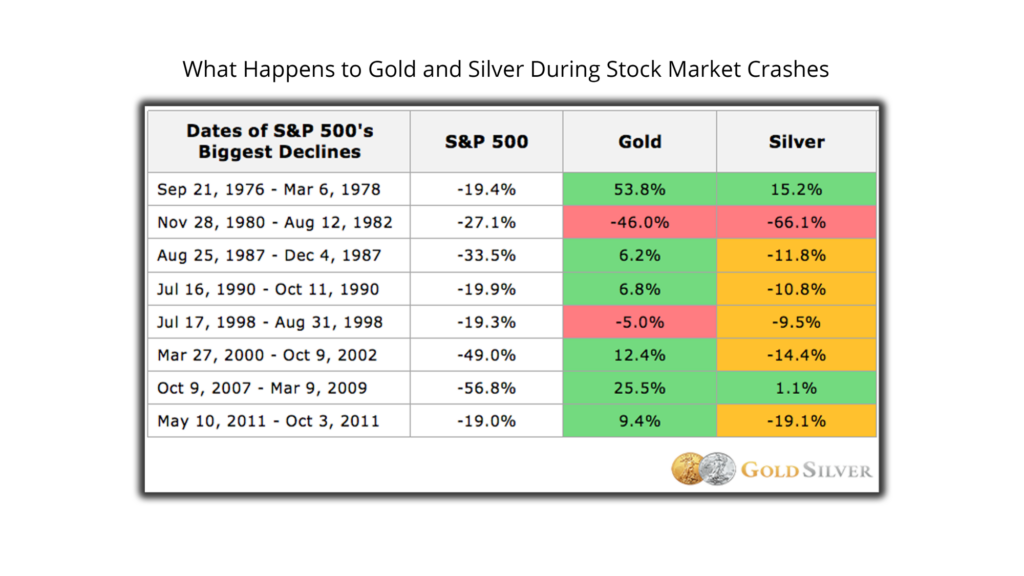
Gold’s only significant selloff (46% in the early 1980s) occurred just after its biggest bull market in modern history. Gold rose more than 2,300 percent from its low in 1970 to the 1980 peak. So it isn’t terribly surprising that it fell with the broader stock market at that point.
Cryptocurrency is the new kid on the block – after all, it has only existed for around 10 years. It might be too early to tell whether crypto can protect a portfolio in times of economic fear in the same fashion as gold. But it’s just another string to your bow.
If you’re looking for more unusual asset classes, which in many cases have no correlation with stocks, then check out our article on alternatives next. In it we look at how you can grow your wealth in a multitude of different investments including song royalties, whisky, and even livestock.
And finally, not all stocks have the same level of risk. A pioneering pharmaceutical company looking to cure cancer is riskier than a dependable utility company that provides clean water and sewage treatment. If you fear a crash, move to slightly safer stocks.
Do you think we will see another crash of 86% ever again? And what’s most likely to cause it? Join the conversation in the comments below.
Written by Andy
Featured image credit: Rawpixel.com/Shutterstock.com
Also check out the MoneyUnshackled YouTube channel, with new videos released every Wednesday and Saturday:


2 Comments
With Covid still around, the change in government, global warming etc I believe that the signs are there for another crash. Inflation only has one way to go, if not a crash certainly a large adjustment.
I agree that inflation could certainly lead to a correction – the main culprit for high prices right now is the QE money printing of course to pay for covid. Ben
Comments are closed for this article!