

S&P 500 vs global diversification. Which is right for your investment portfolio? Which will perform best? Is it crazy to invest your entire equity allocation in just one country, and does the increased costs of wider diversification outweigh the benefits?
We’re wondering what would happen if we scrapped the global approach and just went with a low-cost, top performing US ETF. That’s what we’re finding out today.
If you’re looking for the best place to invest, then check out our handpicked favourite investment platforms here. Also, don’t forget to check out the Offers page where you can grab free stocks with Freetrade and 25% off Stockopedia, plus many more.
Alternatively Watch The YouTube Video > > >
Why Are We Considering This Now?
When I first started investing properly around a decade ago most of the literature and information sources were heavily biased towards investing in the UK market. Even to this day there’s still far too much emphasis from the media on investing in our home market. FYI, the UK only makes up around 4% of global market cap, so it makes no sense to put all your wealth there.
It took me years to wean myself off this UK focus, and now as our regular viewers will know both Ben and I invest in stocks from all around the world. This wide diversification and global stance is probably what the UK FIRE community advocates most.
However, a lot of Americans only invest in US stocks, particularly the S&P 500, and they do alright. We always put this down to the same sort of home bias that we used to demonstrate ourselves, but one they could get away with as the US stock market and USD dollar is so dominating. 57% of the FTSE ALL-World index is comprised of US stocks.
Also, investing gurus like Warren Buffett have reinforced the idea that the S&P 500 is all you need as he has instructed the trustee in charge of his estate to invest 90 percent of his money into the S&P 500 and 10% into government bonds for his wife after he dies.
For index investors there’s really not that much you need to do, other than invest as much you can and wait for time and compounding to work its magic. We spend most of our efforts on strategies to minimise fees and taxes, so we capture as much of the index returns as possible. In other words, what we’re attempting to do is track the REAL index as closely as we can.
What we’ve learnt is that this is much easier to do with certain indexes like the S&P 500 than it is with others, such as global indexes. So, this raises the question: is it worth paying extra for global diversification… or is the S&P 500 all you need?
What Is The S&P 500?
If you’re considering investing solely in the S&P 500 then we should definitely take a look at exactly what it is first.
The S&P 500 index contains the majority of the biggest and best companies domiciled in the US. The word “domiciled” is key, and we’ll come back to this. The S&P 500 is considered to be one of the best single gauges for the U.S. equity market, and the index captures approximately 82% of the total U.S. equity market value – practically all of it.
It is a market-cap-weighted stock market index, effectively meaning the largest companies make up a larger slice of the index. Everyone will be familiar with the top holdings as it includes huge companies like, Apple, Microsoft, Amazon, Google’s parent company Alphabet, Buffett’s Berkshire Hathaway, and so many more behemoths.
Recently it has become known for its large technology exposure with most of the top holdings being tech giants.
S&P 500 Returns vs The World
We’ve seen some people wrongly assume that the S&P 500’s incredible returns and outperformance over the last few years will continue. Basing investing decisions on historical performance of just a few years is probably madness, but how many years do we need to look over before that madness becomes a long-term trend – potentially signifying a long-lasting advantage?
We decided to compare 51 years of total return data – which was the max we could get – to see how the S&P 500 stacks up against the MSCI world index.
The MSCI world index is an index comprising of 23 developed markets and covers 85% of the market cap of each country.
In annual terms the difference was fairly close, with the world index returning 9.8% vs 10.7% for the S&P 500. But in total terms, that’s a huge difference. $100 invested in the world index would be worth $11,625 vs. $18,197 for the S&P 500 – that’s 56% more!
Bear in mind that as of now, US stocks make up 67% of the MSCI world index, so for the S&P to outperform it by such a large margin, would suggest that US stocks absolutely annihilated the non-US stocks within the world index.
Of course, there’s no guarantee that history will repeat itself, but we think there’s something about the United States that gives its companies a sustained competitive advantage.
Despite this long-term outperformance, there’s something reassuring about the wider diversification achieved by investing in global markets. For the sake of argument let’s assume that we’re all happy to sacrifice that extra potential return. How much is that extra diversification worth paying for?
The Real Cost of Tracking An Index
As we mentioned, the world index returned 9.8% per year and the S&P 500 returned 10.7% per year. Fantastic, but we can’t actually get those returns because there are fees and taxes that will massively drag on what we get to take home.
We think most investors are aware that fees and taxes exist but don’t really understand their magnitude. We hope that what we’re about to show you will shine a light on these unwelcome performance headwinds, and help you organise your investments to maximise after-tax and after-fee returns.
Our favourite investment tool is the ETF, and the most common way to compare ETF costs is with the Ongoing Charges Figure or OCF. OCF’s are extremely useful to get an idea of costs but they too are not fool proof.
Tracking difference is a much better gauge of the true cost but even that has its limitations. Tracking difference is the difference between the returns of the fund and the target index. Unfortunately, all ETF and fund providers mislead their investors about which index they should be benchmarked against.
For example, it would be reasonable to assume that an S&P 500 ETF tracks the S&P 500 total return index, but you’d be wrong. They all track the S&P 500 NET Total Return index, which has a deduction for 30% withholding tax – even though no sensible UK investor would ever pay this much.
A quick glance at the performance chart of an ETF would lead you to think that you were beating the index, when the reality is you are most definitely not!
The best way to calculate your ETF costs (and taxes) is going to require a little work. We’ve gone ahead and done this for the ETFs that we like to invest in and a few other popular ones, so we can compare and refine our investment strategy.
We’re comparing the actual index total returns – commonly known as gross returns – and comparing them to the actual returns of the ETF. The difference we’re calling the Real Tracking Difference.
The Real Tracking Difference
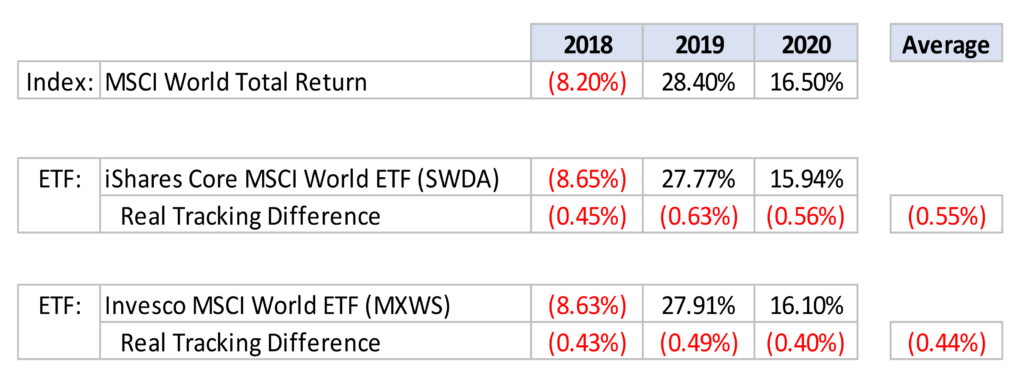
What we’re looking at here is the actual returns of the MSCI World index over the last few years. We’ve then benchmarked it against the iShares ETF, which is the most popular ETF tracking this specific index. Despite it only having an OCF of 0.20%, it is on average under hitting the index by -0.55% every year.
The Invesco ETF, which is synthetic, does a better job because it avoids certain withholding taxes, but still under performs the index by an average of -0.44% per year.
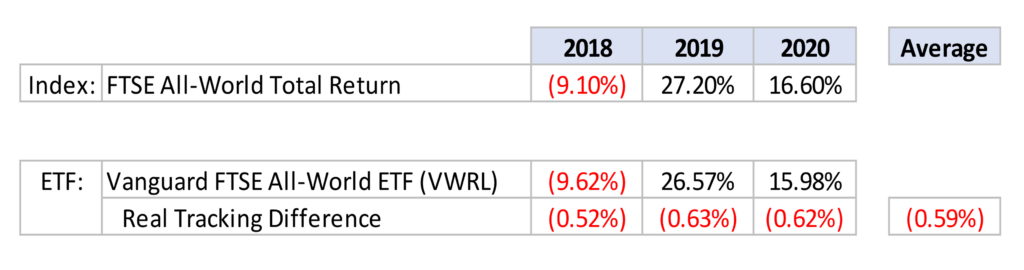
A not too dissimilar index is the FTSE All-World that Vanguard’s VWRL ETF tracks. Shockingly, the Real Tracking Difference for this ETF is -0.59% per year on average.
What this means is if you are tracking global stock markets you are not actually achieving the returns you might have thought you were.
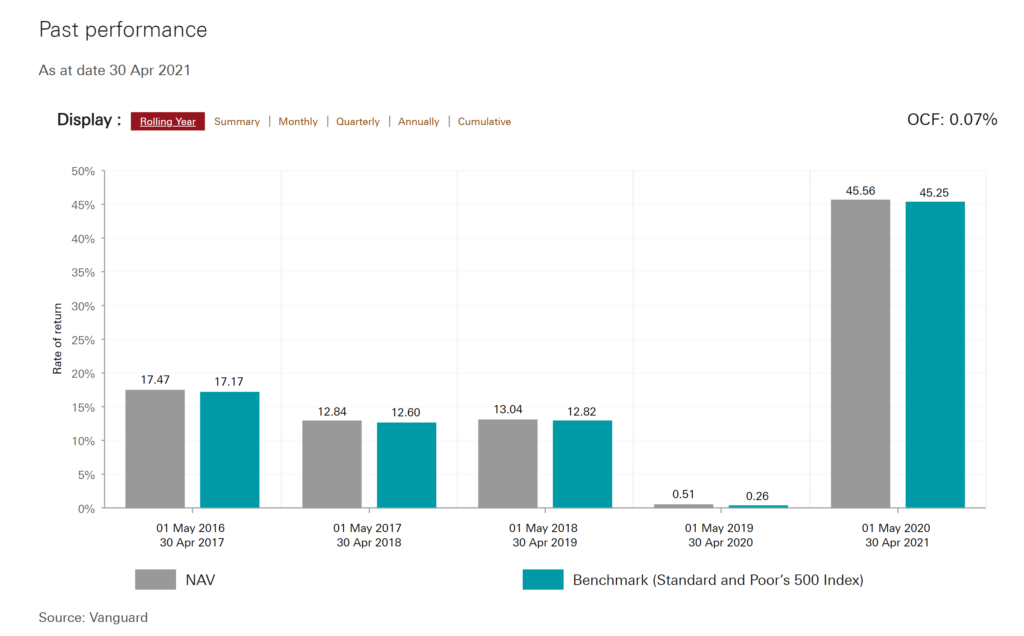
The next question is: how close to the index can we get with an S&P 500 ETF? For a start, the OCFs are much lower. The Invesco ETF is as low as 0.05% and iShares and Vanguard are both 0.07%.
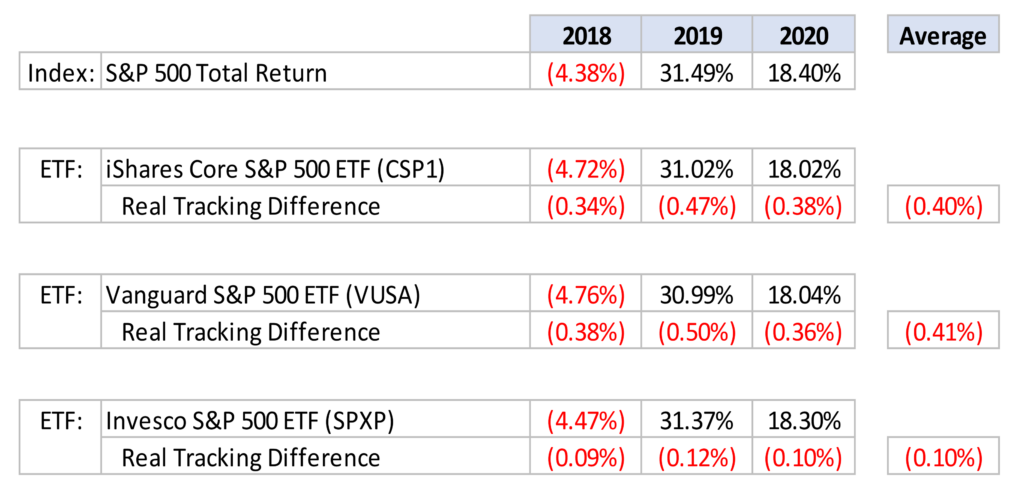
When we benchmark these with the actual S&P 500 total return index, we see that both iShares and Vanguard still have Real Tracking Differences of -0.40% and -0.41% respectively. Not great but noticeably lower than the world alternatives.
Moreover, it is possible to get that Real Tracking Difference down to practically nothing with a synthetic ETF. The Invesco ETF does exactly that – under hitting the index by just -0.10% per year on average.
The best MSCI World tracker misses the target by -0.44% and the best S&P 500 tracker just misses it by -0.10%. That means the World Index would have to outperform the S&P 500 by 0.34% every year just to match its returns. An outperformance of this size seems highly unlikely mathematically considering that 67% of that index is comprised of US stocks.
When we add in the tracking difference to the historical index returns, the world index returned 9.3% vs 10.6% for the S&P 500. Over the 51 years, the total difference is now even greater. $100 invested in the world index would be worth $9,472 vs. $17,377 for the S&P 500 – that’s 83% more!
Tighter Spreads
The cost benefits for the S&P 500 don’t stop there. The ETFs tracking the S&P are much bigger in terms of assets under management and have much more volume passing through them, which means the spreads are far tighter.
When you buy a stock or an ETF the buy price is higher than the sell price. It’s what’s known as the bid-offer spread. The more liquid an ETF is the tighter that spread will be, which is precisely what you want.
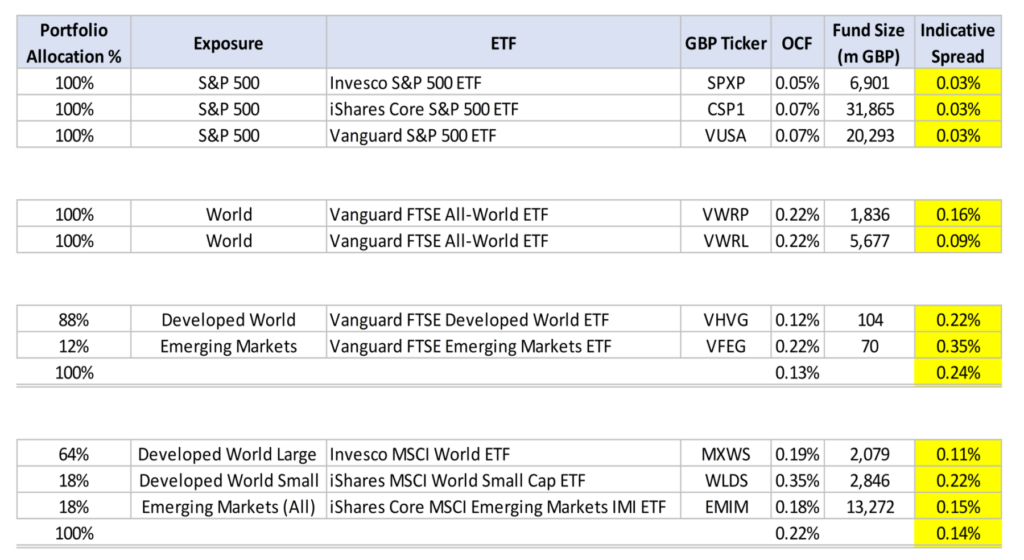
Again, we compared the spreads for a bunch of ETFs and the S&P 500 ETFs were cheap as chips. Their spreads were 0.03% which is practically non-existent. Although the other ETFs we were comparing to were also cheap there spreads were large enough to think twice about frequently trading in and out of them.
Qualitative Factors
#1 – Diversification
Investments should not be chosen just on the potential return – risk should also be considered. The main reason beyond this cost analysis to still invest globally is diversification – not putting all your eggs in one basket.
However, the counter argument to that is that although the S&P 500 is just US domiciled stocks, they are in fact global companies that just so happen to be based in the US. 29% of their revenues come from foreign markets.
Also, the S&P 500 has an increasingly growing concentration risk. The top 10 components make up 26% of the entire index. That’s a lot of exposure to just a handful of companies. Adding in stocks from around the world helps to dilute this.
#2 – Follow The Leader
A qualitative argument for just investing in the S&P 500 is that the US market dictates what happens everywhere else. In this interconnected world it would be unthinkable for the US to suffer a recession and Europe to be cruising along at the same time.
In fact, this can be seen in the behaviour of the UK stock market. In any given day it might be performing well, but as soon as negative news comes flooding in from the US this can be turned on its head in an instant.
#3 – Blurring The Lines Between Active And Passive
One potentially important point to note is that there are certain eligibility requirements to be included in the S&P 500 and a committee ultimately has the final say, which is why a giant like Tesla was only recently included despite being one of the most valuable companies on the planet.
Excluding certain stocks in this manner is dangerously close to active management, which is fine if you want that but a red flag if you don’t. World indexes are much more reliant on a rules-based approach.
#4 – The US Is A Safe Haven
This probably won’t last forever but for several decades the US and the US dollar have been a safe haven. When markets were tanking in 2020 during the Covid crash, investors rushed to the US dollar. So, as the S&P fell in dollar terms, the impact was softened by the increasing value of the dollar against the pound – meaning UK investors holding wealth in the S&P were affected less than what they could have been.
How Are We Responding To This?
We’re generally undecided. Changing how you think is not easy and takes a while – think of it like an oil tanker turning.
Also, when everyone else is saying you need global diversification it’s difficult to go against the grain. We fully agree with the benefits of diversification but is the additional cost worth it?
What do you think? Is the S&P 500 all you need? Join the conversation in the comments below.
Written by Andy
Featured image credit: Immersion Imagery/Shutterstock.com
Also check out the MoneyUnshackled YouTube channel, with new videos released every Wednesday and Saturday: