How To Become An ISA Millionaire

Surely everyone’s dream is to be an ISA millionaire – to have built up £1m in your ISA. Not only are you rich, but your income comes from a tax-shielded ISA – meaning you’ve opted out of the tax system for good. No more greedy HMRC groping around in your bank account!

Saving and investing enough money to become a millionaire is quite an achievement.

But these days, thanks to Individual Savings Accounts – known as ISAs – it is possible to build up £1million much more easily than it used to be, because there is no tax to pay on income or capital gains while you’re building your pot.

Despite this, shockingly few people have taken up the opportunity to have their income paid in tax-exempt dividends and capital gains.

You don’t need to be a high roller with a trust fund to be part of the elite ISA millionaire club.

In this article we’re going to show you how anyone can build up £1m in their ISA, on any budget.

But we’ll also show you how to do it quickly, we’ll address the roadblocks in your path, and tell you how to turbocharge your compound returns by cutting costs and doubling up your contributions.

And best of all, we’re going to look at the data on real-life ISA millionaires, and crucially, what they invested in to become ISA millionaires. It turns out they invest very differently to most investors!

Alternatively Watch The YouTube Video > > >

The Main Obstacle

The ISA is one of the most generous financial products in the world, so thumbs up to the UK government for this rare acknowledgement that saving for your future is a good thing.

But of course, they don’t make it easy.

You are only allowed to deposit a maximum of £20,000 a year into an ISA, and you can only deposit into one of each type per tax year – which runs from the 6th April to the 5th of April the following year.

£20,000 may sound a lot of money – but if your goal is to become an ISA millionaire, this is quite a hindrance.

In a previous video where we looked at official ISA statistics we learnt that a large number of people either use all of their annual allowance or barely use any.

Back to the £20k allowance, if we assumed zero returns, for instance by using a Cash ISA, then it would take 50 years to save £1m by depositing the maximum £20k each year.

But nobody in their right minds would attempt that. Luckily, Cash ISAs aren’t the only game in town.

Basic Timeline To ISA Millionaire Using A Stocks & Shares ISA

Stocks & Shares ISA investors could become millionaires in just 20 years based on historic returns for world stock markets, by making the maximum ISA contribution.

The below analysis from Schroders shows this nicely. ‘20 years’ is based on the average annual return of 8.3% that was achieved for the MSCI World Index over the 25-year period 1993-2018, with all dividends reinvested.

This is before inflation, so they also looked at a 5% real return, which would take 25 years, and a pessimistic 4% real return, which takes 28 years.

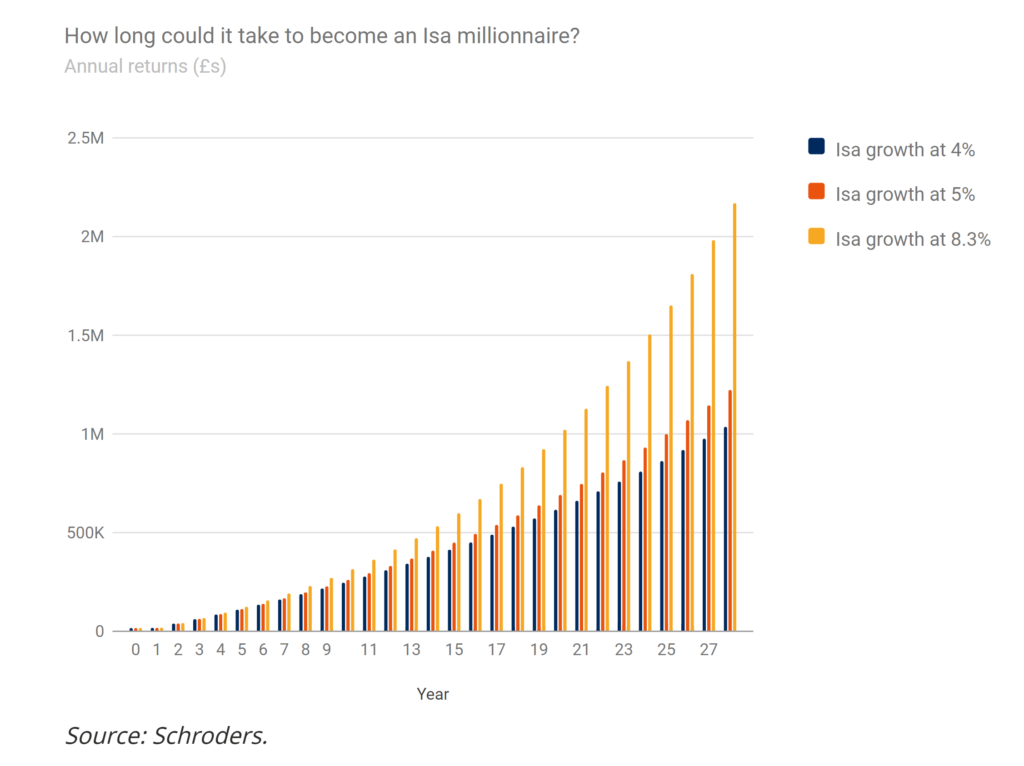
We almost take that 4% as a worst-case scenario, knowing what we do about the performance of the stock market over the last 100 years. It’s the best place to hold your money long-term, in our opinion.

Say you were able to start depositing £1,667 a month – £20k divided by 12 – at age 40. Not unrealistic if you work your way up the greasy pole in your career, or start a business.

That would make you an ISA millionaire in your 60s. And any contributions you make while you’re younger will drag that date significantly closer due to the power of compounding returns.

Also, it’s possible that a future government will raise the ISA limit further – after all, it’s been climbing since 1999 when the limit was only £7k.

Who’s to say you won’t be able to deposit £30k, or £40k in future years? Of course, it could just as likely be cut too, so it’s a good idea to use the current allowance in full while you can!

Keep Costs Low

If you’re serious about being an ISA millionaire then you must keep your investing fees down. That’s because compounding works in reverse when it comes to your costs.

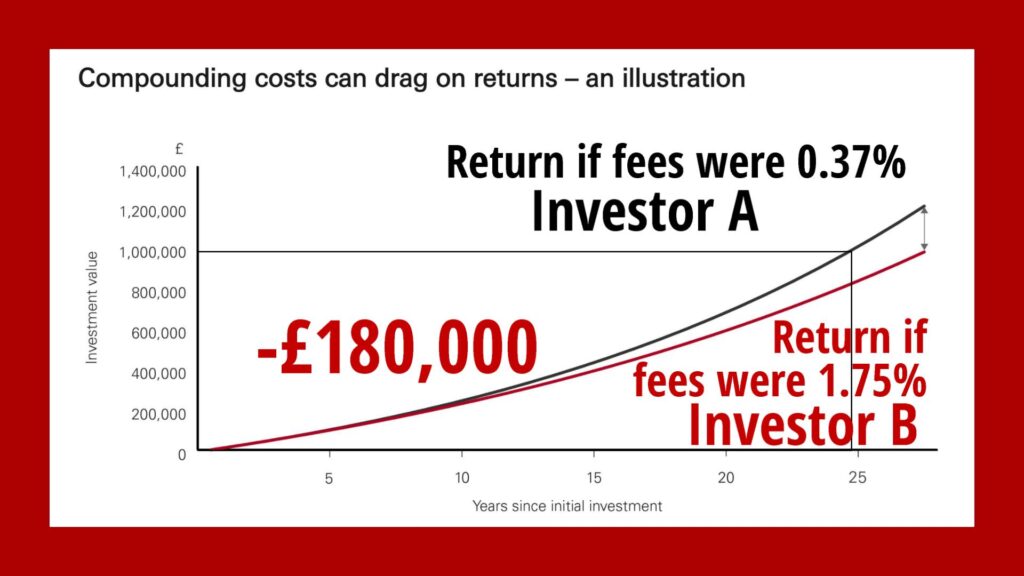
he below study by Vanguard shows the difference between investing the £20k maximum into your ISA each year at a 0.37% fee (which is Vanguard’s platform fee plus an average fund fee), and a hypothetical ISA with total fees of 1.75%.

Both these numbers sound small. But the difference on a 6% return meant that Investor A reaches millionaire status 3 years before Investor B, with Investor B being behind by around £180,000!

The moral? Get fees right from the start, and the journey will be a lot smoother.

Avoid Other Taxes

An ISA doesn’t protect you from all taxes, and you’ll want to minimise them all if you’re going to be an ISA millionaire.

If you’re investing in stocks from outside of the UK – which you probably should be if you want to be diversified and get the best returns – you’ll likely be getting stung by dividend withholding tax.

The US is a big culprit for this, and we estimate the drag on your returns from withholding tax to be around 0.3% – based on a 2% typical US dividend yield multiplied by the 0.15% tax.

We’ve found a way around this by packing your portfolio with synthetic ETFs – for more info on saving tax in this way, check out this article next.

Perfect Strategy vs Keeping It Simple

There’s getting there quickly as an experienced investor, and then there’s getting there at all regardless of your investing skills.

As we said, anyone can become an ISA millionaire – you don’t need to be interested in the nuts and bolts of investing.

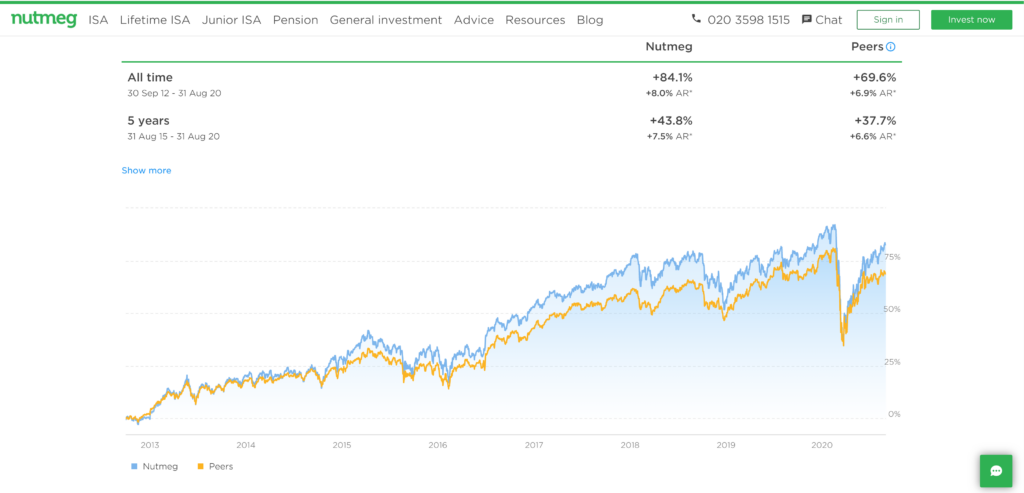
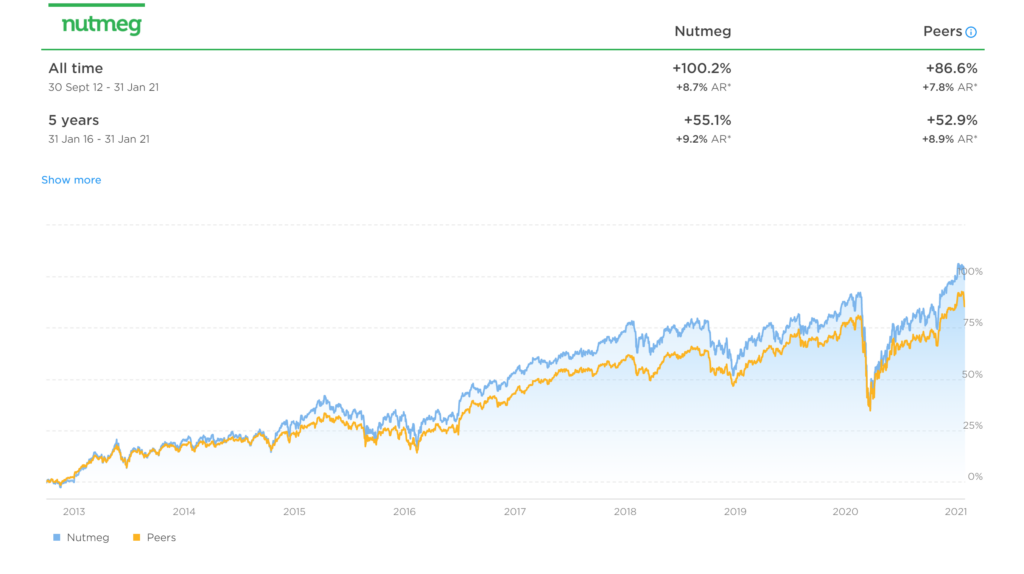
For this reason, opening a Stocks & Shares ISA on a robo investing app like Nutmeg might be best suited to the average person.

Nutmeg has a history of consistent high returns and they do it all for you, using globally diversified ETFs. You can literally open an account, set up your monthly deposit payment, and forget about it.

If you find your way to Nutmeg via the link on the Money Unshackled Offers page, your account fees will be reduced to zero for your first 6 months.

How Many ISA Millionaires Are There?

Research by the Telegraph in 2015 suggested there were only around 200 ISA millionaires. In 2018 they updated that number to 1,000.

As of February 2021, there are 731 ISA millionaires on the Interactive Investor platform alone (a third of which are women), so presumably the total number in the UK now runs into the several thousand. The average age of an ISA millionaire on Interactive Investor is 71.

Even though the number of ISA millionaires is increasing, it’s still shockingly low, though granted ISAs and their predecessors PEPs have only been around since 1987 – and deposit allowances were miniscule back then.

But with 1 million people using Interactive Investor, just 731 of them being ISA millionaires is a weak effort by the British public.

We believe achieving ISA millionaire status by age 71 is achievable for anyone due to compounding returns, as all you really need is patience, whatever your budget.

Really, getting there at age 71 should be your worst-case scenario, as you should be able to get there far earlier than this, now that ISA allowances are £20k.

Just think about this – you could have had a 50-year run at being an ISA millionaire by age 71, by saving only £380 a month, at an 8% average stock market return.

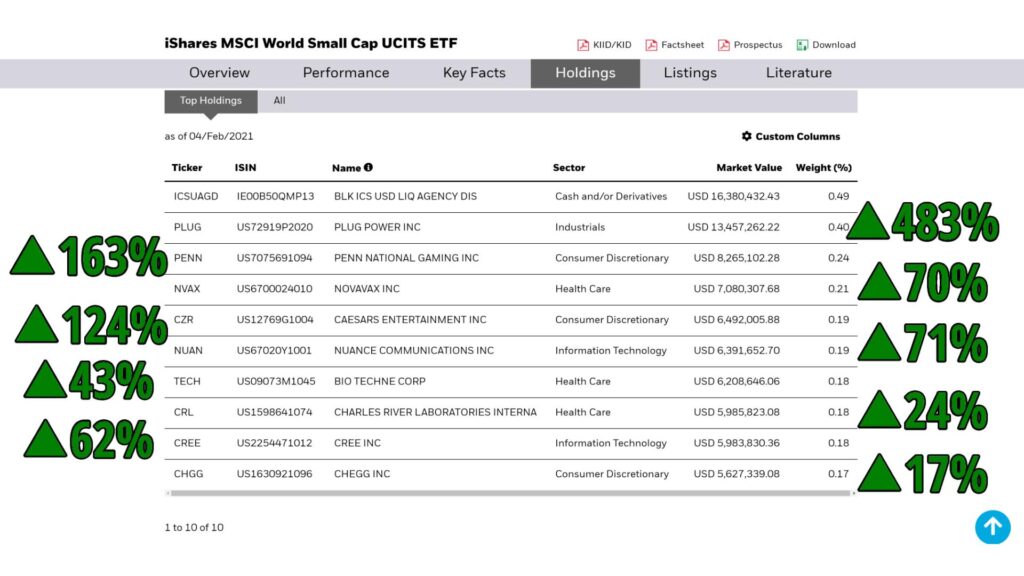
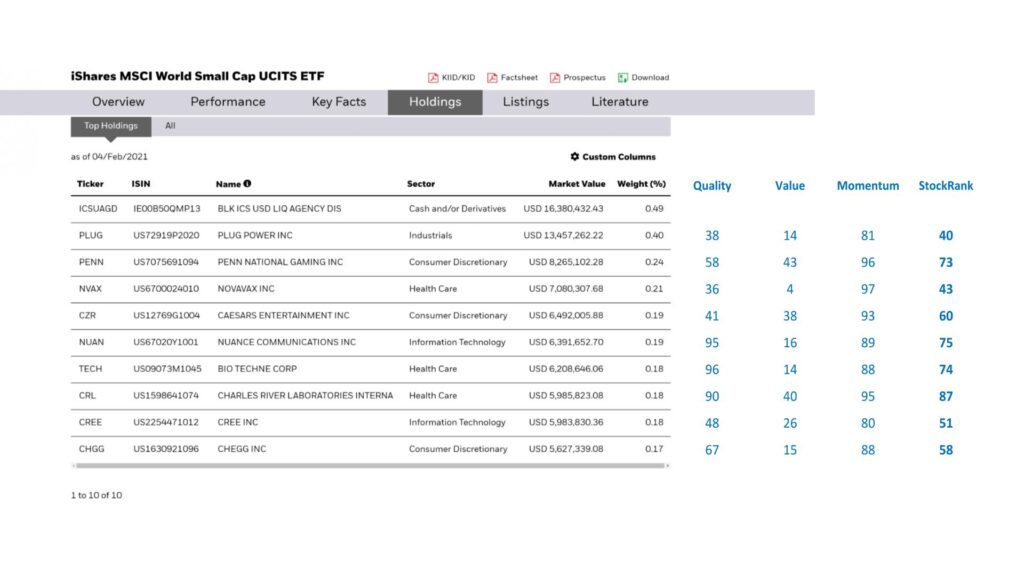
What Do ISA Millionaires Invest In?

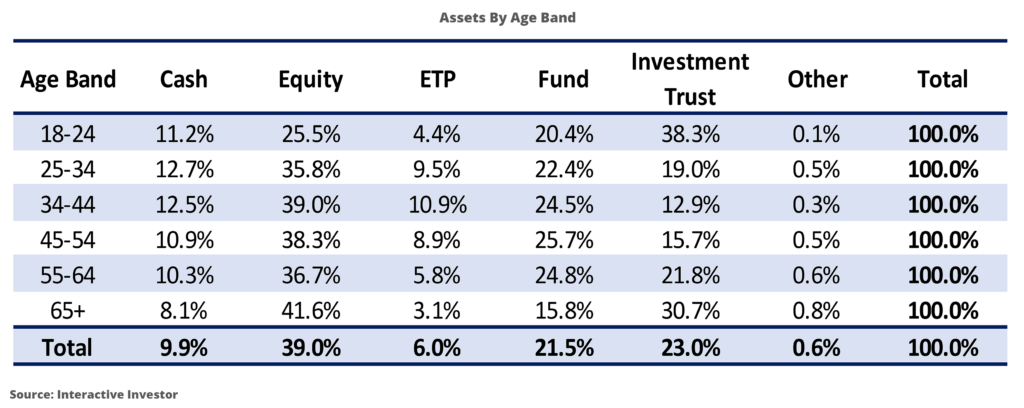
Sticking with Interactive Investor data – because they’re so open with it – here’s what the average ISA millionaire’s account looks like compared to an average user:

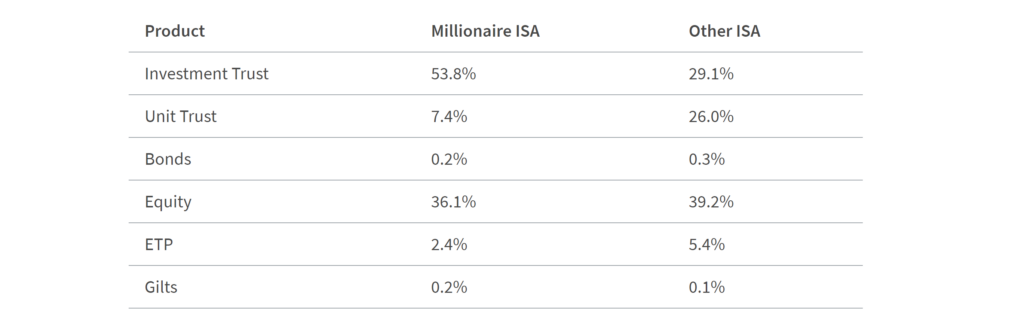
Interestingly, they invest quite differently to the average Joe, with 53.8% of their portfolios made up of Investment Trusts.

They don’t care about bonds, despite being the target audience in their 70s, nor do they bother much with ETFs (included in the ETP bucket), which are our bread and butter.

This is probably because ETFs are modern products and these investors are well into their retirements, and people tend to stick with what they know.

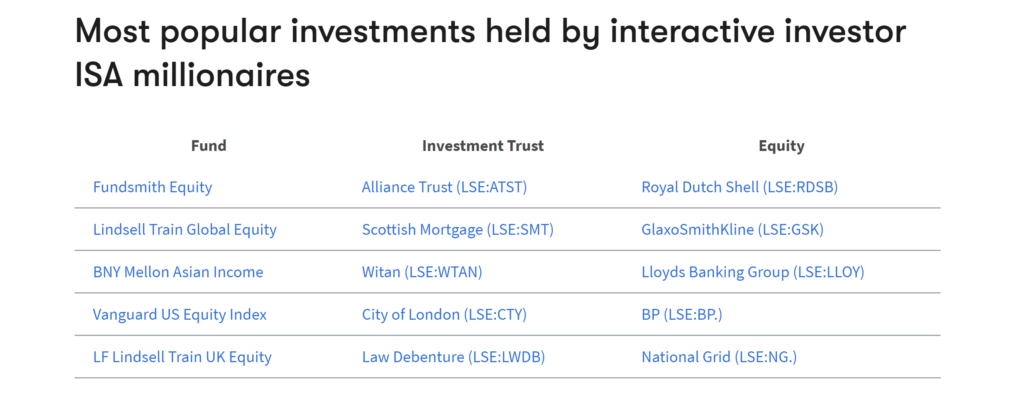
The top stocks among the ISA millionaires are Royal Dutch Shell and GlaxoSmithKline, and the top Investment Trusts are Alliance Trust and Scottish Mortgage:

But what is it about their love of Investment Trusts?

Investments Trusts are the oldest type of fund – around for over 150 years – so older investors will have grown up with them.

Investment Trusts have tended to outperform other fund types over the long term, but that’s not to say they’ll continue to do so in the future.

2020 saw the largest-ever outperformance of the FTSE All-Share by investment trusts, with the FTSE Equity Investment Instruments Index (FTSE EII) producing a total return for the year of 17.8% compared to a negative 9.8% for the FTSE All-Share.

Finally, their ability to borrow to enhance returns means they can give a portfolio a boost over the long term.

How ISA Millionaires Trade

Interactive Investor ISA millionaires make 24 trades in a year on average, compared to 9 for the average ISA customer.

And the average ISA millionaire has 28 stocks versus just 8 for the average ISA account, despite trading fees encouraging fewer holdings.

This somewhat goes against the ‘buy-and-hold’ philosophy and suggests a slightly more active approach might pay off.

That’s How Today’s Pensioners Did It – Should Our Generation Be Doing The Same?

Given your target is long-term growth, we agree that it’s worth avoiding bonds and sticking predominantly, if not exclusively, to equities.

By all means do this by using Investment Trusts, if you’re able to pick the winners from the losers.

But ETFs are so diverse, flexible and cheap that they will likely always form the core of our ISAs.

Want to invest in BioTech? Silver? Artificial Intelligence? China? There’s an ETF for pretty much every theme that you could want to invest in.

Double It Up With Your Spouse

Are you married? Couples get a £20,000 annual ISA allowance each, so between you, you could be saving £40,000 a year.

Recalculating the compounding based on £40k, £1m could be achieved in 14 years rather than 20 at that pace. That’s ISA millionaire status in just a over a decade from now.

Downside Of Being An ISA Millionaire – Inheritance Tax

We can’t think of many downsides to being an ISA millionaire, but the big one is what happens to your money on your deathbed.

In a pension, your wealth can get passed on tax-free to your heirs depending on the age you go. But an ISA is subject to inheritance tax.

So, the taxman catches up with you eventually – just when it’s no longer your problem.

But there are clever tax strategies to reduce or avoid IHT even with your ISA that you can look into later, so don’t let this put you off reaching for your dream.

The ISA Year End Is Coming!

The ISA year end is fast approaching – if you have £20k in cash, get it into a Stocks & Shares ISA now!

The annual allowance for how much can be put into an ISA cannot be carried over into future years, so for the current year’s allowance, it’s now or never.

And if you’re looking for the best Stocks & Shares ISA, check out our guide here next.

Are you planning on becoming an ISA millionaire? What are you investing in? Let us know in the comments below!


Feature image credit: Gustavo Frazao/Shutterstock.com

Check out the MoneyUnshackled YouTube channel, with new videos released every Monday, Thursday and Saturday:

Why Your Pension Is Failing You – SSAS/SIPP/Workplace Pensions

Unless you’ve taken a day to sit down and really review your pension situation, your pension is almost certainly failing you.

In the UK most of us just trust our financial futures to our employer, and just assume that our workplace pensions are being well managed – and that’s if we’re trying to be sensible.

The less sensible among us will be trusting their futures to the state pension – which is like putting your trust in a tiger not to eat you.

But this video is aimed at those who want their private pensions to shine, to outperform the mundane, and to set you apart in your retirement from the majority who are just barely able to get by.

We’ll show you how to get your pension working for you: how to withdraw money from it before you’re retired, how to break free of mediocre returns, how to add investment property into your pension, and how to dodge tax to the max while staying within the law. Let’s check it out!

Alternatively Watch The YouTube Video > > >

What Normal People Do

Most people in the UK of working age contribute to a Defined Contribution workplace pension. As well as this, they will hold several other workplace pensions from past jobs, probably one from each.

A UK worker will change employer every five years on average, which means your average 40-year-old will have 4 pensions on the go; 3 of which are no longer contributed to.

We were a bit more trigger-happy with the job-quittings when we were in the workforce, and between the two of us we’d racked up 11 workplace pensions by age 32 – none of which were doing a great job for us!

The problem with many workplace pensions in the UK is that they are UK biased. More than that, they are overly keen on low performing bonds.

One of MU co-founder Ben's old workplace pensions

Above is the breakdown of one of my old workplace pensions. Around 30% of it is bonds. For a 30-year-old, that is far too unambitious.

Bonds can be useful for people approaching pension drawdown age. But for someone with 3 decades to go until that happens, it’s frankly laughable.

Also, 38% is in UK equities – notorious for its low returns in recent decades. Why is this pension not investing larger amounts in the USA, the world’s economic powerhouse?

The answer? Workplace pension funds are stuck in the past, still conforming to home bias from the days before global investing became cheap and accessible.

Impact Of Home Bias And Too Many Bonds

The presence of too much UK equity and bonds is clear from the returns. This Aegon pension returned 5.5% annually over 5 years, which is 30% total growth:

Underwhelming performance of the old workplace pension

Over the same timeframe, a typical globally diversified equity fund – VWRL – returned 7.3% annually, which is 42% total growth. Lightyears ahead.

The problem with turning a blind eye to your pensions until you’re ready to retire is obvious – you’ve left it too late to make any necessary improvements.

The optimum time to get a grip on your pensions is the day you start your career – failing that, the next best time is today.

Finding out that your pension was invested in underperforming assets for the last 40 years at age 60 is not ideal. And yet this is what the majority will do.

Why Workplace Pensions Can Get Away With Poor Performance

They need to impress your employer – not you. And the wage-slave making the pensions decision for their company is unlikely to know much about investing.

A workplace pension provider could be chosen on the basis of sweet-talking the HR department better than the competition, rather than a proper long-term appraisal of their investment strategy.

What The Rich Do

Rich people don’t hold their futures in employee pension schemes. These schemes are too restrictive, with annoying rules that forbid you from accessing your own money until you’re at least 55.

Such rules don’t apply to the rich, nor to those aspiring to be rich who follow in their example.

They know better, and make use of a little-known type of pension called a Small Self-Administered Scheme pension, known as a SSAS.

SSAS Pensions – True Financial Freedom

A SSAS is a flexible pension usually for company directors of limited companies, managed by you (or by trustees that you appoint). Don’t let the ‘company directors’ part put you off – both Andy and I are company directors, as are many people who invest in property, as can be anyone who puts their mind to it.

We’ll come back to this point in a bit, but first let us tell you why you need to be aspiring towards having your future invested in this type of pension.

Once established, a SSAS pension can invest in all the normal assets such as stocks and shares, commodities, corporate bonds, and gilts – but it can also hold any investment property that you buy, and even shares in your own business.

It also gives you vast additional powers and opportunities, including getting your hands on your pension money whenever you need it, instead of in your late 50s like with other pensions.

Why You Should Have A SSAS Pension

#1 – Get Your Money When You Need It

You are allowed to make a loan of up to 50% of the value of your pension to your company for any use.

For example, you could use the funds in your pension to buy out part of your own company (i.e. giving you, the owner, a load of money). Alternatively, it could be structured as a loan to yourself.

Can you imagine dipping into your workplace pension at age 30? Well, you could, if your pension was a SSAS.

#2 – Invest In Property

As we touched on already, pensions don’t have to just invest in stocks and bonds – with a SSAS, you can use your pension cash to buy investment properties too.

One of our biggest annoyances with ISAs is that they can’t be used to buy properties (outright – we don’t mean REIT funds).

Well, a SSAS is an alternative tax-shielded product that you can do just that with, and still have some flexibility to access to your money at any age.

#3 – Very Tax Efficient

Contributions can be made by both you and your company – and because your company is probably you, this means tax loopholes!

SSAS pensions get the same basic tax benefits of other pension types, including:

  • Pension contributions are deductible against tax;
  • No income tax charge on investments;
  • No capital gains tax on investments;
  • A tax-free lump sum on retirement.

But SSAS pensions get extra tax benefits too:

  • Commercial property can be bought by the SSAS and leased back to your company, which may have tax advantages (also possible in some SIPPs);
  • Loans can be made to your business – the interest, which is effectively payable to yourself, could be tax deductible;
  • You have greater control over accessing lump sums, which might have tax advantages over normal pensions.

#4 – Fees Are Fixed

Fees are typically charged on a fixed basis rather than the traditional percentage charges for most normal pensions, and is shared amongst the members.

The ones we’ve seen cost between £300-£1,000 a year, no matter the size of your pot. This is great for wealthy people – probably not great for smaller pots.

How To Qualify

You usually need to become a company director, which can be of your own limited trading company.

Becoming a company director is not difficult – setting up a company online takes a few minutes and costs just £12 to do on the UK government website.

SIPPs – For Getting Your Finances In Order Now

Being a director with a SSAS pension is something cool to aim for maybe in the future when you have large funds to take full advantage.

But to help you get there, a SIPP is the perfect pension product for taking back control of your future, today, that anyone can open.

A SIPP acts like a workplace pension, but has the following advantages:

  • You can consolidate all previous workplace pensions into one SIPP which is under your control – what you invest in is completely your choice, not some pencil-pusher in HR;
  • The returns are therefore likely to be much better if you choose a more sensible mix of assets;
  • The fees are usually lower than what a workplace pension charges you.

The simplest SIPP we’ve come across is run by Nutmeg. It’s also one of the highest performing against their peers. You can see here how it smashes the competition:

Nutmeg SIPP performance

Over that same 5-year period as we discussed earlier, Nutmeg produced a 7.5% annualised return after fees, similar to the 7.3% we’d have expected from a global fund.

Nutmeg is a robo investing platform, offering ISAs and SIPPs. When you open one of these, you’ll be asked a series of questions, so that your portfolio is tailored to you.

Gone is the one-size-fits-all approach of the workplace pension, which tries to work for everyone, but ends up working for no-one.

You’ll also get 6 months without any fees if you find your way to Nutmeg via the link on the Money Unshackled Offers page. Check out the Nutmeg offer there if you want to open your own SIPP and get to grips with your pensions.

When A Workplace Pension SHOULD Be Used

There’s no doubt in our mind that a SIPP is preferable to an old workplace pension. But what about your current, active, workplace pension?

Your employer is probably matching your contributions to your current pension, in which case, that is a 100% return in year 1 and is free money which in most cases shouldn’t be turned down – regardless of how crappy the underlying investments may be.

For instance, I opened a SIPP for transferring my old workplace pensions into, which I’d accumulated from many previous jobs.

But I would always contribute into one current workplace pension, for the tax-free top-ups my employer would pay in alongside my own contributions.

ISAs

Finally, you should ask yourself, do I even need a pension?

If you are able to set aside less than £20,000 a year, have no employer contributions, and are a basic rate taxpayer, then a Stocks and Shares ISA might be preferable to a pension.

You get similar tax benefits – the tax break comes when you draw from it, rather than during accumulation as with a pension, but it works out roughly the same in the end.

And you can retire whenever you feel ready – instead of a predetermined minimum age of 58.

As for us, we currently use SIPPs for our pensions, but as company directors we will be looking into transferring those into a SSAS as our wealth gets bigger.

But at least with our SIPPs, our investment returns are strong, our fees low, and our futures are in our hands.

What will you be doing with your pensions? Join the conversation in the comments below!


Featured image credit: Sauko Andrei/Shutterstock.com

Check out the MoneyUnshackled YouTube channel, with new videos released every Monday, Thursday and Saturday:

These Small Cap Stocks Are Up 33% In 6 Months!

Small cap stocks are taking off!

The MSCI World Small Cap Index has absolutely skyrocketed over the last 6 months, up by 33%!

To put that into context, the last 6 months have been incredible for the S&P500, but even that only went up by 17%.

So small caps have given investors double the return that they could have gotten by investing in the biggest American companies.

This MSCI World Small Cap index is a core component of the Money Unshackled Ultimate Portfolio, which is what our own portfolios are now built around since we streamlined them a few months back.

So we’ve been pleasantly surprised to watch this chunk of our wealth jumping up, and up, and up every week since!

But this has got us to thinking: if the index of over 3,300 small cap stocks can climb by 33% on average in 6 months, what enormous heights must some of the underlying holdings have achieved?

Is it too late to jump on the momentum of some of the individual stocks, including many that rose by 100% and more?

We’re not so sure. 2021 looks ideally suited for continued small cap growth.

Today, we’re looking at why small caps are currently kicking ass, why we think they will continue to do so for a while longer, where to find small cap stocks, and we’ll look at some high performing individual stocks too.

Alternatively Watch The YouTube Video > > >

Why Small Cap Stocks Are Smashing It

Small Cap stocks have a number of different definitions, but for the context of this article, Small Caps are stocks with a market value in the bottom 15% of companies in the developed world, except for the bottom 1% (which MSCI label Micro Caps).

Because small caps are… well… small, they have very different qualities to larger companies that can be an advantage at certain points in the economic cycle.

Small Caps are:

  • More nimble
  • More adaptable
  • Less regulated
  • Breeding grounds for new ideas
  • High growth potential

These traits make them ideally suited to outperform in an economic recovery, which the stock market is anticipating, and which should remain throughout the next couple of years at least.

The ones that survive the crisis adapt to their new surroundings. Many other small operations take advantage of the open space left by lumbering larger companies that can’t keep up.

What’s Going On In That Small Caps Index

The Small Caps in the developed world are overwhelmingly US companies. 59% of them in fact.

This isn’t surprising, because the US is an ideal location to start a business, with its capitalist economy, rule of law and technological and scientific excellence.

MSCI World Small Caps Index Geographies

Below is the top 10 – apart from the top holding which is just some money market asset, these are all US companies.

Digging down into the month returns on some of these: Plug Power’s up 483%! Penn, a casino company, is up 163%. Novavax, a vaccine developer is up 70%. And on it goes with solid return after solid return.

Returns On Top 10 Holdings

Finding Small Cap Stocks To Invest In

In fact, if you wanted to stock pick some small caps, looking at the top companies of this index wouldn’t be a bad place to start your research.

All these stocks are available on commission-free trading platform Stake, who are in the process of bumping up their universe to 7000 US stocks, so you’re bound to find Small Caps on there that you can’t find on any other free trading apps. Even better, they are giving away a free US stock worth up to $100 to everyone who signs up via the link on the Money Unshackled Offers page!

Small Caps In 2021

Even though Small Cap stocks outperformed Large and Mid Caps in 2020, they are predicted by the experts to continue this outperformance in 2021.

A typical comment from the institutional investing sector comes from CEO of Grit Capital, a former $100m portfolio manager: “They have strong prospects going forward… there is more room to run.”

Morgan Stanley Wealth Management’s chief strategist says that “Small Cap stocks outperformed on average in the months following the troughs of Large Cap stocks during past recessions”.

“In the six, 12 and 24 months following Large Cap troughs, Large Caps gained 31.5%, 29.4% and 48.2% on average. However, the gains were larger with Small Caps that generated 46.9%, 53.4% and 86.2%.”

A strong economic recovery would benefit Small Cap stocks since they are more sensitive to what’s going on in the economy.

2021 is supposed to be the year of the vaccine.

This means 2021 has the potential for a strong economic recovery from those vaccines, but also from governments chucking more funds from the magic money tree into the economy.

Quick, nimble, adaptable Small Cap stocks with fresh ideas should outperform Large Caps in that environment.

Any fiscal stimulus such as tax breaks should propel small companies along further than large companies, who are typically well funded and more secure anyway, and so don’t really need much help.

Rising inflation is also somewhat linked historically to stronger Small Cap performance, according to Morgan Stanley.

Inflation flatlined in 2020, but the economy opening up again should reverse this, to the likely benefit of smaller companies.

CPI Inflation in the UK

A Quick Look At Some Small Caps

The MSCI World Small Cap Index got awesome returns, but you could have done much better by handpicking some of the many winners.

Let’s look again at the Top 10 stocks in the index. We ran these through Stockopedia to check out the fundamentals and see how we might do by investing in these stocks.

Top 10 Holdings with Stockopedia rankings

What should really stand out to stock pickers is that, while their overall stock ranks are a mixed bag, the Momentum of each stock is incredible.

These are stocks that are on the rise with no obvious sign of slowing down.

That’s just as well, because few of these stocks offer good Value, meaning their incredible recent share price growth and high valuation isn’t reflected in their current operating profit.

But maybe this doesn’t bother you if you think their future potential beats current profitability.

Maybe Charles River Labs with a 90 Quality score has a high enough Momentum that it’s mid-range Value score is acceptable, and can still make you a decent return?

Let’s have a look at some of these stocks, starting with Charles River Labs.

Charles River Laboratories (CRL)

These guys are an American biotech company – that’s right, the sector that’s leading the vaccine charge against coronavirus, and will be instrumental in protecting us from future health risks.

We’ve already mentioned their sweet overall fundamentals, but what else can we tell you about this company?

It’s Value metrics aren’t great, with a high forward PE Ratio (31) and forward EV to EBITDA (24) but a high PE ratio isn’t necessarily a bad thing as this suggests other investors are bullish about its prospects.

On Stockopedia, it qualifies for some screens (always a good sign on Stockopedia), has great health scores (all in the green), and an almost unrivalled track record of earnings per share growth.

It’s rare to see a stock with such consistency in earnings growth. It’s in double-digits pretty much every year, including the 2021 forecast.

Over on the cash flow side, it’s taken on a load of debt recently, but this was to acquire other businesses.

Charles River does this a lot, and it’s clear from the earnings growth that the company is skilled at making good acquisitions.

We’re just going to draw your attention to one more stock – we want to know more about Nuance, because they’re a high-quality, high-momentum company that designs artificial intelligence.

Nuance Communications Inc (NUAN)

6 brokers including Morgan Stanley and Barclays have this as a Strong Buy. So, the market loves this stock. But what do we think?

Well, it’s fundamentals are pretty average, but the reason we think there is such excitement around this Small Cap stock is its incredible forecasted Earnings Per Share growth of 120%.

What’s more, it’s a profitable company in a very cool field; AI. They are a tech company delivering solutions that understand, analyse, and respond to people.

Where it’s adding the most value right now is developing customer service tools like chat bots and call centre software, that should one day replace the need for human customer service staff.

The savings to businesses would be huge. Technology that saves businesses money is technology that makes its shareholders rich!

Sticking With Small Caps

Small Caps are an essential, but often neglected part of any portfolio, in our opinion.

Obviously short-term traders can have some fun with high-momentum small caps like the ones we just showcased, but longer term investors should be giving Small Caps some respect too.

We showed you in this article how Small Caps tend to have higher returns over the long term and so can help beef-up your pension pot but are more volatile in the short term.

And we showed you in this article how long-term historic comparisons between Large Caps and Small Caps have Small Caps coming out on top in the age of the internet.

We’re sticking with small caps – they make up around 21% of our core equity allocation, despite being just 14% of the developed world’s market cap.

Will you be joining us in investing in small caps in 2021? Join the conversation in the comments below!


Featured image credit: Utekhina Anna/Shutterstock.com

Check out the MoneyUnshackled YouTube channel, with new videos released every Monday, Thursday and Saturday:

Super Stock Portfolio – Automated Stock Picking With Stockopedia (& Trading 212 Pie)

Most investors know that if they build a portfolio of index tracking funds and invest for the long-term, they will retire rich.

Using historical returns as a gauge we can expect to make around 8% per year from such a strategy. Not bad!

But despite this, millions of investors, including us to a certain extent, cannot help but try and beat the market, which usually leads to higher risk and inferior returns.

Picking individual stocks is notoriously difficult and is often time consuming if done properly.

Is there a way of making market beating returns without the effort of scrolling through endless accounts and continually monitoring the news and stock performance?

Here we’re going to build an experimental investment portfolio of 20 stocks by taking a few shortcuts.

The goal is to automate stock picking as much as possible, build a complete portfolio in less than 10 minutes, and remove emotion from our decision making. Let’s check it out…

This portfolio will be built in a Trading 212 Pie using analysis tools found on Stockopedia, specifically looking at Super Stocks.

Stockopedia is a premium analysis, data, and stock screening tool that allows subscribers to narrow down an investing universe of tens of thousands of stocks to a handful that are worth checking out.

Stockopedia doesn’t come cheap though and if you become a subscriber you’ll understand why – it’s awesome!

If you head over to the Offers page, you’ll find a free 2-week trial to Stockopedia so you can have a play, and 25% off the first year should you choose to stick with it. You must use this link to get the offer.

What Stocks To Buy

Below are the 20 stocks that we’re buying for this experimental portfolio. All of these have been identified as the best Super Stocks that satisfy our rules-based selection method.

Most of you will probably have never heard of these stocks. But don’t let that put you off. We haven’t set out to build a portfolio of famous brands. We’ve set out to build a market beating portfolio with almost zero effort.

In a bit we’ll look at some of the stocks to get a quick overview of what we’re actually buying.

The Top 20 Stocks On Stockopedia (Per Our Rules)

A StockRank and whether it’s a Super Stock or not can and does change on a daily basis, so we will be regularly updating this portfolio throughout the experiment – we will be looking to refresh the portfolio every few months or so.

We’ve also shared the Pie within Trading 212, so you can check that out on the app, linked here.

As we’ll be updating the pie on occasion you may want to save it or even copy it if you want to join in with the fun.

While we were at it, we went ahead and created a Pie for the Money Unshackled Ultimate ETF portfolio, linked here, which we talked about in this article. These ETFs make up the core of both of our actual ETF portfolios.

The Newly Added MU Pies On Trading 212

What Is A Super Stock?

Every company on Stockopedia, which is now over 63,000 stocks, is analysed for its Quality, Value, Growth and Momentum across hundreds of fundamental and technical metrics.

They all come together in a set of scores, which Stockopedia call StockRanks.

Subscribers to Stockopedia will see these in the top right of every stock page and they are a fantastic way for investors to get an immediate view of a stock.

Straight away we can see here for Facebook that its Quality and Momentum scores are phenomenal, but investors will have to pay for it as its Value score is in the bottom half of stocks:

Facebook Stock On Stockopedia

The higher these StockRanks are the higher the probability of success is. Although Facebook looks good, it is not a Super Stock, so doesn’t make the cut in this portfolio.

A Super Stock is where a stock is ranked highly across all 3 Ranks.

Portfolio Rules

We have decided to keep rules to an absolute minimum because we want to test the true effectiveness of Super Stocks, rather than apply lots of subjective conditions.

We’re going with UK and US stocks only because we need to actually be able to buy them, and stocks listed in the UK and US will be the most widely available to us. There’s no point building a hypothetical portfolio that nobody can actually buy.

The next rule we’re applying is a minimum market cap of £50m. We’re going with this number because the bigger the company the more likely it is that the stock will be available on free trading apps like Trading 212, Freetrade and Stake.

In fact, even with a £50m market cap many of the stocks were not available in the Trading 212 pie, meaning we had to omit that stock and move on to the next Super Stock in the list.

We have decided to limit any one sector to a maximum of 3 stocks. We’re limited it to 3 because we want to ensure the portfolio is well diversified.

Without doing this there is a good chance that the stocks would all congregate around a few sectors and failing to diversify is a rookie mistake.

The last and final rule is that the stock must be available in the Trading 212 Pie so we could share it with you guys, but as we discovered this severely limited us in what stocks we could buy.

We applied all these rules and sorted the list from highest Stock Rank to lowest, and then a secondary sort on market cap. We’ll be buying 20 stocks and investing 5% in each one.

Must Use A Commission-Free App

We’re going to chop and change the portfolio frequently, so it will soon get very expensive if you’re paying for each and every trade.

It’s a catch-22 situation. Only the traditional platforms have all the stocks, but their high trading fees means we have no choice but to make do with the commission-free apps instead.

We actually had to cycle through 120 stocks until we were able to build a portfolio of 20 stocks based on our predefined rules.

We had 2 stumbling blocks: The first issue we had was due to our own rule of limiting each sector to a maximum of 3 stocks. Then the second major issue was lack of availability in the Trading 212 Pie.

A Quick Look Inside

We’re not applying any subjective analysis on these stocks for this experiment, but for curiosity let’s take a quick look at a handful of the stocks that made the cut.

Mohawk Industries (MHK)

The stock is US listed and is valued at the equivalent of £7.5 billion. Stockopedia are currently giving it a Stock Rank of 99.

They are a flooring manufacturing company who provide carpets, rugs, tiles, wood, and other flooring products.

Having no prior knowledge of this company and only looking at the StockReport it’s difficult to see why this company is ranked so highly.

It doesn’t look bad by any means but equally it doesn’t set the world alight. Stockopedia’s algorithm must be looking at much more datapoints than we are. 

It’s quite cheap, with an EV to EBITDA of just 10.48, and its business doesn’t seem to have been too badly impacted by Covid, with revenue down slightly.

If it wasn’t for this experiment we would disregard this stock – maybe to our disadvantage. But rules are rules, so it gets a place in the portfolio.

Kingfisher (KGF)

A company and industry that we know a little about already. Kingfisher is a home improvement company and is listed in the UK and owns B&Q, Screwfix, and some other brands that we’re not familiar with.

Its revenue hasn’t really gone anywhere in the last 5 years, but it has received a little boost from Covid due to people being stuck at home and doing more DIY.

The company looks to have strengthened its balance sheet with a huge increase in cash and therefore a reduction in net debt.

This looks to be a steady investment that won’t break the bank as the shares are relatively cheap with an EV to EBITDA of just 7.45.

Synnex (SNX)

We’re frequently drawn to tech stocks as they always seem to have the potential for supercharged growth, so a company like this in the portfolio is exciting.

The biggest challenge with tech stocks is understanding what they do.

When reading their business profile, all we see is gibberish, but the company is doing something right as their revenue has been surging over the last 5 years – but a sudden slowdown in 2020 and 2021 is perhaps due to Covid.

We’re not going to spend any time finding out exactly why this is, but it does seem odd – a lot of tech stocks have had super years with businesses rushing out to use the services of tech specialists.

Nevertheless, the company has continued to improve Earnings Per Share, and is forecast to continue doing so.

Surprisingly, the stock is dirt cheap, with an EV to EBITDA of just 4.59 and a PE ratio of just 5.7. It is very unusual for a tech stock to trade at such a cheap valuation.

Stockopedia are putting the technology sector average PE at almost 27, so Synnex could be a hidden gem.

CVS Health (CVS)

We can’t look at all the stocks, so let’s wrap it up with CVS Health. This is the biggest stock in the portfolio with an equivalent market cap of £68 billion.

We really like the look of this stock with its first impression. The company is a US based pharmacy business with almost 10,000 retail locations.

Healthcare is one of those essential products that is needed no matter the state of the economy and it would seem based on their revenue and earnings that Covid has significantly boosted their P&L.

Price-wise CVS looks cheap. The PE ratio is just 9.5 and its EV to EBITDA is 8.25. The one bad fundamental that stands out is its debt. Its gearing ratios are sky high and its Net debt is 4x operating profits. That would normally be a red flag.

Enhancements

Obviously, what we’ve done today is very basic. You might want to take this idea and add in some additional rules. Perhaps you want to automatically exclude stocks over a certain PE ratio or when debt exceeds X times the operating profit.

Whatever you want, you can do this on Stockopedia, so check them out with our special offer on the Offers page.

Will you be joining in with this experiment, and how well do you think the portfolio will do? Join the conversation in the comments below or over on YouTube.

Check out the MoneyUnshackled YouTube channel, with new videos released every Monday, Thursday and Saturday:

How Did Investors Do In 2020

2020 has been a year to forget – but on the flip side, stock market performance has been a rollercoaster, starting badly and finishing strongly. In normal times, stock markets are often correlated, which means if one particular region does well, others tend to perform strongly also.

For example, when the S&P 500 powers forward, indexes in Europe, the UK, and elsewhere also tend to do the same, and when the S&P does badly, these indexes also tend to struggle.

This has not been the case in 2020 at all – with an enormous range of performances between and within different asset classes. This has meant some investors have been kicking ass and taking names, whilst others have been left with their head in their hands, wondering why they didn’t diversify properly.

At the end of every year, it’s always a good idea to check your investment performance, and we like to compare it against a reasonable benchmark. There’s no point giving yourself a pat on the back for a 10% gain if the market was up 20%. Something like Vanguard’s FTSE All-world ETF is a good yardstick.

But in addition to this self-review, we’re interested in seeing how other investors have performed – just because we’re nosey!

Interactive Investor have just released what they’re calling the Private Investor Index, which gives us insight into how private investors are faring on that platform. In this post we’re going to look at the highlights of this information and take a quick look at how different asset types performed in 2020.

Interactive Investor is the UK’s second-largest investment platform for private investors and has the biggest investment range that we’ve seen. They have a fixed platform fee, so is amongst the cheapest platforms for investors with larger pot sizes. You can check them out here.

Average Returns

Overall, it seems that the average person didn’t perform well in 2020 with a median average return of just 1.8%.

Although this is low compared with typical stock market average returns, we are actually surprised how high it is because the UK stock market was smashing investor’s portfolios to pieces with dire performance.

The FTSE 100 was down -11.55% on a total return basis in 2020, with the FTSE All Share down -9.82%.

The FTSE is heavily weighted with old-school energy stocks like Shell and BP, and financials such as Lloyds Banking Group and HSBC, so recessions can and clearly have punished UK indexes. On that note, these sorts of stocks could be poised to do well during a recovery and have been doing awesome since the turn of the year in 2021 but that is a story for another day.

We know from other studies that there is lots of home bias with investors, so UK investors have way more UK exposure than what you would get with a global index. However, for the average investor to come in with a positive 1.8% return means that most are at least diversifying into other regions and asset classes, which is good to see.

Investment Performance By Age

Interactive Investor have kindly dived deeper into this analysis and broken performance down by age. And quite honestly, we are very surprised at the number of higher positive returns considering what we just said about UK stocks.


Investment Performance By Age In 2020

The crown for best age band goes to 18–24-year-olds, who clocked in with a very healthy return of 8.1%, and there is a really interesting trend of decreasing returns with increasing age. This even turns negative for those over 65 at -0.9%.

Interactive Investor’s own analysis of this data suggests that they give the credit of this strong performance by the youngsters to having the largest allocation to Investment Trusts, and further boosted by their overseas and alternative asset exposure.

We don’t talk much about Investment Trusts at Money Unshackled because we prefer passive investments, but clearly Investment Trusts are doing something right, at least in 2020.

According to JPMorgan, 2020 saw the largest ever outperformance of the FTSE All-Share index by investment trusts – the FTSE Equity Investment Instruments Index (FTSE EII) produced a total return of 17.8% vs. the FTSE All Share, which as a reminder was down -9.8%.

Going back to performance by age band, the overall trend of decreasing returns by age comes as no surprise.

Generally, older people de-risk their portfolios as they age because they have less time to recover from any catastrophic collapse in the markets, so are less likely to hold large positions in companies like the FAANG stocks or Tesla, which were stand out performers in 2020.

Older people also grew up in a time when foreign markets were much harder to invest in, so may be more likely to have a UK home bias, even to this day.

Also, we suspect that younger people were better able to take advantage of the extreme volatility that occurred around March time. Younger people are less likely to have existing large sums invested because they have had fewer years to accumulate wealth. So, new money invested for younger people when markets were very cheap will make up a larger part of their portfolios giving them more upside potential.

Conversely, older people would likely have experienced a large decline from the crash caused by Covid and then new money invested would be a smaller proportion of their overall wealth. This is why we don’t really pay much notice to new investors when they brag that they’ve made 25% this year. It’s easy to make big returns on new money.

Type Of Investment By Age

Another interesting set of data provided by Interactive Investor is the type of investment by age band.

Assets By Age In 2020

Cash is held at around 10% across the age bands. Interestingly, 10% is the allocation we suggest people hold here at Money Unshackled, so either everyone has been watching and reading our content or this is a coincidence – you decide 😊

Do bear in mind that this is just the assets held within Interactive Investor. Holding cash long-term in an investment platform is not a great idea because no interest is paid.

Moving on to equity, which we assume they just mean individual stocks: surprisingly the young guys have less than old ’uns – a lot less. The over 65s have almost 42% in stocks whereas the under 24s have just 25.5%.

Our best guess is that young people are more aware of the commission-free trading apps and are perhaps more likely to do their stock trading with apps like Freetrade and Stake. Both of these platforms are giving away free stocks when you use our link, so feel free to check those offers out on the Money Unshackled offers page.

ETP stands for Exchange Traded Product and includes ETFs and ETCs. We can’t believe how small a percentage these make up for investors across the age bands at just 6.0%. As far as we are concerned, ETFs are single-handedly the best investment product available. They give huge diversification, at dirt cheap fees, in almost any type of investment.

Funds seem to be evenly liked across the age bands. These often behave similar to ETFs if they are passive funds, but active funds are also very popular, although we don’t see that split from this particular set of data.

What we would have liked to see is funds broken down into more types – whether that be bonds, equity, or mixed, and whether they were active or passive.

Performance by Wealth

II have promised more analysis by wealth in the future, but for now they’ve said that the wealthiest customers on the platform (meaning £1 million+ accounts) made their presence felt with average gains of 8.7%.

This sounds like it might contradict what we said earlier about existing investors having taken large hits from the Covid crash. However, it is highly likely that someone who has built up an investment pot of over £1m knows a thing or two about successful investing or has outsourced it to a professional.

Active vs Passive

We all know that passive investing over the long-term is best, don’t we? Or is it? Well, in 2020, it seems that accolade goes to active investors, who Interactive Investor are defining as those who trade at least twice a month.

These active investors grew their portfolios by 6.3%, which smashed the 1.8% average.

Although active investors won this round, many studies have shown that a passive approach does perform best on average over the long-term, and we might chalk up 2020 as being an unusual year.

Battle Of The Genders

Men or women? Who’s best? We’ve looked at this fight before when we looked at ISA statistics but now II have chipped in and given their two pennies’ worth.

Men win this round with a 1.8% return vs. 1.4% for women.

This comes despite the fact that women had more investment trust exposure than men – 27.5% for women versus 20.7% allocation for men.

Who’s The Best: Regional Returns

Are Southerners better at investing than Northerners? Well, in 2020 they were. Londoners earned a decent return of 2.94%, which smashed the returns of the North West and North East at 0.17% and 0.26% respectively.

But the real investing champions were the Scots, who put us all to shame with a return of 3.22%.

Those in the Channel Islands beat everyone with a return of 4.56%, but with a population smaller than most towns we’re disqualifying them for not fielding a full team.

Asset Types: The Good And The Bad

Looking at total returns in pounds from another II article, the best performing stock market was China with an absolutely phenomenal return of 25.5%. Not bad considering the US has been stealing all the limelight for stock market gains.

The US has of course been doing very well themselves with the S&P 500 up almost 15%, and the Emerging Markets up about the same.

If you’ve seen our video on the Ultimate ETF portfolio you might recall that we’re going quite heavy on all 3 of these regions, because we’re expecting strong returns here for years to come.

And right near the bottom is the UK – but this could be a quick turnaround in the near future due to Covid vaccinations rolling out in 2021.

Bonds, whether that’s inflation linked, gilts, or corporate bonds, have all done very well in 2020.

Investors were spooked by the economic harm caused by Covid, and the monetary measures taken by Central Banks caused lots of money to flood into bonds and push up prices. It seems unlikely they will do well in the next few years with interest rates looking like they can’t fall any further, but who really knows?

And finally, gold had an awesome year, up over 20%. We never used to be gold’s biggest fans, but with all the debt and money printing that is taking place, we are well and truly converts. That’s why we now say hold 10% of a portfolio in precious metals to help protect the downside.

How have you done in 2020 and what was the main driver of that performance? Join the conversation in the comments below.

Performance data from Interactive Investor

Check out the MoneyUnshackled YouTube channel, with new videos released every Monday, Thursday and Saturday:

How Much People Saved & Invested In Lockdowns

Here’s another in our series of 2020 wrap-ups, this time looking at how saving and investing shot up for most people during the lockdowns of 2020.

Curiosity in investing has skyrocketed in the last year due to a combination of 3 factors:

  1. it’s easier to do than ever before thanks to free trading apps;
  2. the economy melting down made people stop and think about their own finances; and
  3. people on the whole have been saving way more money during lockdowns than they would normally be able to.

Today we’re looking into this last point in detail. How much have people been able to save and invest during the lockdowns?

Of course… it isn’t the case that everyone is better off.

For those of you who have done well out of lockdown, we’re also going to look at where you might want to prioritise putting that money, to get yourself prepared, for if – or maybe when – the economy really starts to tank.

Stake are giving away a free US stock worth up to $100 to everyone who signs up via our link on the Offers Page – be sure to check that out!

Artificial Problem – Artificial Solution

While lockdowns are an artificial problem, put in place by government order, the financial solution to them is coming from another government order – the furlough scheme and related business loans. So far, the 2 policies are largely offsetting each other financially for many people.

Because of unprecedented financial support for the private sector from Boris and Rishi, the bulk of Brits have so far been able to keep calm and carry on despite lockdowns – in many cases improving their financial situation.

How Much Are People Saving?

The Centre for Economics and Business Research reports that households saved £7,100 on average in 2020, thanks to the lockdowns preventing them from spending, and most being able to maintain their jobs.

A study by AA Financial Services shows that 85% of UK adults spent less during the lockdowns.

Some of the largest savings areas were petrol (£49 a month), staying away from pubs and restaurants (£57 a month), and avoiding the shops (£53 a month).

In total people still on a full income were able to save £617 a month on average.

The Bank of England back this up, reporting that personal bank deposits have grown by 3x the recent average, with 31% of savers increasing their monthly deposits over the timeframe. Are people investing that money or just letting it rot in the bank?

Well, the US Bureau of Economic Analysis reckons that similar spending cuts to what’s been seen in the UK are also being seen across all the major economies, with most of the difference being diverted into savings accounts.

We know that investing is much more culturally embedded in America than in Britain, so we can expect a higher proportion of spare British money to be directed towards savings rather than investing.

We’re investors, so every last penny we’ve found ourselves up by during this pandemic has gone into the stock market and other assets. After all, saving for 0% interest is a chump’s game.

We want to know if investing activity has gone up, not just because it’s interesting to know, but also because more noobie investors entering into the market tends to push up asset prices, and can even lead to bubbles.

How Many People Are Investing

We know that the average saved was £7,100, but it’s safe to assume that most of that ended up in savings accounts rather than investment platforms.

However, 2020 did see a huge rise in individual investors taking to the markets for the first time.

eToro saw a 420% increase in investors’ trades between January and June 2020, compared to the same period a year earlier.

Interactive Investor reported a 119% increase between April and August 2020, and AJ Bell a 200% annual increase for March to April that year.

Across the board, hundreds of thousands of people have been turning to investing to store and grow their wealth.

But has this huge flow of money into the stock market had any effect on stock prices? Are new investors chasing rising prices or are rising prices partly due to new investors?

What Happened To Asset Prices

There’s a strong argument that the rush of new investors into the market in 2020 has caused asset price bubbles in the “trendy” stocks and industries: such as big tech, clean energy, and anything to do with electric vehicles.

It also may be partly behind why we now see a K-shaped recovery. That is, some industries like Tech recovering while others like Travel continue to slump:

K-Shaped Recovery

Take Tesla for example. Since March 2020, Tesla went from an adjusted $72 a share to over $800, and saw a PE ratio of over 1000, riding a wave of media coverage and new investor enthusiasm.

The rise of free trading apps and innovations like fractional trading made it easy for anyone to buy shares, and the data shows that new investors overwhelmingly favoured the big name brands: Tesla, Apple, Microsoft and Amazon being the main beneficiaries of their cash.

It’s not just individual stocks – a rise in popularity of ETFs as an investment vehicle may mean that stock prices across the board in major indexes have been pushed upward by the flow of new investors, as ETF providers must now buy more of those companies to meet demand.

Let’s now look at what happened at the other end of the financial spectrum.

What Happened To Household Debt?

The Bank of England has revealed that consumer debt fell after the first lockdown by £7.5 billion – this reversed a trend of increases every month since 2013.

This is a combination of people having lower expenses and paying down their debts instead; and fewer opportunities to use a credit card, plus the fear of uncertainty stopping people from wanting to take out new loans.

Not Everyone Has Benefitted

One of the few positives of living under lockdown is being able to save more money. But that just isn’t the case for many low earners.

Right now there is a widening financial gulf opening up between middle and low earners.

The K-shaped recovery doesn’t only describe a split in industries – the analogy can be applied to the condition of the home finances of middle earners vs low earners.

While spending decreased for higher and middle earners; the lower your income, the more likely that your outgoings would have gone up during lockdown:

Low Income Families Impacted The Hardest

The problem was even predicted last Spring, with Universal Credit being increased by £20 a week in April 2020 in response to the lockdowns, but it hasn’t seemed to help much.

We can see that over a third of the lowest earners are having to cope with higher expenses than usual – and of course, this is both terrible and unsustainable.

There are several explanations for this, such as:

  • being forced to shop locally, at higher prices than the supermarket because you don’t own a car (and might want to avoid public transport right now);
  • higher heating costs because you and your kids are home all day during winter;
  • but no chance to offset this with the cost savings that middle class office workers saw from avoiding Pret a Manger lunches and dress-for-success work clothes, because they didn’t have these luxuries anyway;
  • home-schooling meant having to buy in extra equipment;
  • they are furloughed, on 80% of an already low wage.

The saying “the rich get richer” is true because rich people can take advantage of opportunities as they arise.

Conversely, it’s also true that the poor get poorer, as they get shafted harder when there’s a crisis.

We should reflect that while many have benefitted from lockdown, many have not, and Rishi and his magic money tree will have to make sure that these people don’t fall through the cracks.

For Those Lucky Enough To Have Financially Benefitted – Choose How Best To Use It

So if you’ve benefited from a lockdown savings windfall, how can you best direct that cash to protect yourself from a future crisis?

We may not even need to wait all that long.

There’s a fair chance that once the furlough scheme is removed, the shock to the wider economy from mass unemployment will be huge, even for those not directly impacted.

That, or any number of unforeseen issues with vaccine rollouts or new strains of the virus could set the economy back to square one.

Here’s 5 things you should consider doing with your cash while the going is good.

#1 – Clear The Slate

Pay down any short-term debts, especially any high interest ones, and set up an emergency cash fund of at least 3 months wages and ideally more.

You got lucky this time, possibly because your job was kept secure by government intervention.

If the company you work for fails during the next crisis, and government help isn’t possible, at least your personal finances can be working with you, rather than against you.

#2 – Take Out Insurance

It might be worthwhile to have Income Protection insurance in place to cover you for sickness.

That way, you and your family are more likely to be protected if you find yourself incapacitated by illness and unable to work. The next virus to come along might be far worse than Covid-19.

Unemployment Insurance exists too, which protects you from redundancy, but since the pandemic, you’ll struggle to get a quote.

#3 – Invest It

In our view, investing is almost always the superior choice over hoarding money in a bank account.

Given you may need access to this money, opening a General Investing Account or ISA is probably safer than locking it away in a pension – however, your emergency cash fund should have you covered for, well… emergencies.

Remember to grab your free stock in the intro above, and subscribe to our YouTube channel below or surf the articles on this site to learn everything you need to know about investing for the long term.

#4 – Important Upgrades

At time of filming, we’re on Lockdown #3. Who knows how long it will last and how many more there’ll be.

Lockdowns may even be forced upon us next Winter too, according to Chris Whitty. Now there’s a depressing thought!

If you’ve struggled through the last lockdowns with inferior home comforts, and still lack a proper home office, a decent TV, gaming console etc, now might be a good time to spend a bit on making home-life more bearable.

#5 – An Epic Holiday

If you have any money left after securing your finances, why not have a sweet holiday when this is over? After the last year, you certainly deserve one!

Recycled Taxes

At the end of the day, a lot of these savings are just recycled taxpayers’ money – £17.5 billion has been paid out to furloughed workers from the Treasury, and another £7.2 billion to the self-employed.

Much of this may even be given back to the Treasury in future massive tax hikes, as many economists and journalists theorise will happen to pay for the Covid splurge.

But get your finances in line now, and hopefully you’ll be in a good place for the years ahead.

How much did you save or invest during the lockdowns? Join the conversation in the comments below!

Check out the MoneyUnshackled YouTube channel, with new videos released every Monday, Thursday and Saturday:

What Age Do People Really Retire – Retirement Statistics

In the UK, the government recognises age 68 as the age that it’s reasonable to retire. That’s the age you can draw the state pension from.

But we want to know what age people really retire at – and we want to help you work out if you’re on track to retire earlier than this, and by how much.

Your private pensions will allow you to access them up to 10 years before the state pension age.

But how many make it to retirement by even age 58? On this site we’re about having the freedom to retire as soon as possible.

Early retirement doesn’t have to mean sitting in front of the TV. It can be doing charity work; travelling the world; writing a book; or whatever floats your boat!

We’ve gathered together statistics from the UK and around the world to show you what age people are really retiring at – and therefore, what you might expect for yourself. We also touch on how to move this date forwards.

If you still need to consolidate all your old workplace pensions into one place, we’ve arranged for you the first 6 months without management fees when you open a self-invested personal pension with Nutmeg through the link on the Offers Page. The same deal applies for their ISA accounts as well!

Retirement Ages Around The World

First off, let’s look at how the UK compares to the rest of the world when it comes to real retirement age.

Here’s a chart showing the average age that citizens leave the workforce in various countries, using data from the OECD:

Average Age Leaving Workforce (By Country)

This is not the state retirement age. This is the real age that people decide to pack it in and put their feet up.

The UK has an average showing, hardly showering itself in early-retirement glory.

But a point in our favour is that, at a real retirement age of 64, we’re at least beating the official state pension age, which was 65 at the time this data was gathered in 2018.

Our neighbours in France are free from the age of 60, putting us to shame, while our friends in America feel the whip until age 67.

If you’re feeling bored at work, be grateful you don’t live in Japan or South Korea. These guys are slogging away until age 70 and beyond!

But this data shows a fixed point in time, as of a couple of years ago. What was the situation 10, 20 years ago and more? Is the UK getting better or worse?

Real Retirement Age: The UK

The Department for Work and Pensions released this info in 2019 showing that the age of leaving the workforce has gotten worse for men by 2.1 years over the past 2 decades, and worse for women by 3.5 years:

UK Real Retirement Age Trends

This second chart shows that around 60% of over 50s were in the workforce 35 years ago – now, 84% of the over 50s are having to work.

This is obviously a bad directional trend for younger generations looking forward to their own retirement. Will the average exit date continue to creep upwards?

Here’s the age of exit for men and women in more detail:

UK Real Retirement Age Trends (Detail)

Although the real retirement age has gotten much worse in the modern era, the period from the ‘50s to the ‘80s showed the opposite story.

This reminds us of the trend in the wealth gap – shown here for the US, but the same story applies to the UK:

Wealth Gap History (Source: Ray Dalio)

The same period from the 1950s to the 1980s showed the wealth of the bottom 90% (i.e. most people) increasing to a larger percent of the nation’s total. Since the 1980s, inequality has been on the rise, and the wealth gap versus the top 0.1% has been growing.

The story of this graph is that inequality has been reversed before, after a period of political shake up – and can happen again. We’d expect average people to be able to retire sooner if this happened.

Maybe People Are Waiting Too Long To Retire

On the flip side of the coin, pension wealth has nearly doubled in real terms since 2008, but we know it is being accessed later.

If people could retire sooner and with less money a decade ago, why not now?

Pension Wealth Going Up (ONS Data)

We suspect a big part of the reason why people work longer is a lack of financial education about investing, combined with a tough time to be a saver. There is no interest to be earned anymore on your savings.

If you plan to retire before state pension age, you need a good private pension, or you need decent savings to bridge the gap.

In the years before the 2008 crash, interest rates were high, and it was a simple thing for savers to retire and enjoy the high interest, or get generous annuities offering good income for life.

Now, wealth languishes in 0.1% savings accounts, losing real value each year, making a mockery of their life-savings. Today’s would-be-pensioners are fighting an uphill battle.

Retirement Age By Region

Where do you live? If we look at the UK on a regional basis, Scotland is the best place to live for early retirement, with 33% of Scots set to retire before age 65:

UK Regions - Predicted Retirement Age

Surprisingly, despite the highest incomes, London is the worst place to retire early, with only 21% of Londoners predicted to be able to quit before age 65.

Maybe if they’re serious about retiring early, Cockneys may want to swap their jellied eels for haggis and neeps.

When Do People Want To Retire

A study by pensions advice specialist Portafina says that the nation’s dream retirement age is 57.

Presumably those people aren’t investors like the many subscribed to this channel, whose target retirement age could be a couple of decades before that!

But even age 57 is a lofty dream for most, because as we’ve seen, the real average retirement age is 64.

And it gets worse. 21% of Brits have no pension at all. Even 17% of the over-55s have nothing in their pension pot, according to an Opinium survey of 2,000 working adults from June 2020.

Figures from the ONS show that just 7% of people expect to retire before the age of 60. Most will retire at or just before the state pension age, out of necessity.

Ability To Retire Before The State Pension

This next graphic shows, with data for men only, which countries in Europe are able to retire before their state pension age (those in yellow, orange and red). Those in shades of blue, like the UK, are retiring after the state pension date.

European Countries Retiring After/Before State Pension Age

Women, not included in this graphic, actually help bring the totals down in the UK to just below the state pension age, as they retire earlier.

The Italians retire over 4 years before their state pension kicks in, and pretty much all of Europe bar a few pockets comfortably retire before the state tells them they can.

What we think we’ve shown so far is, you don’t want to be an average UK worker!

Years To Retirement By Savings-Per-Month (SPM)

What we really wanted to know, was at what age people are able to retire, based on the amounts they save each month from their income.

Try as we might, we couldn’t find any studies that have looked into this area, even though it’s got to be the one thing that everyone in the investing community really cares about!

What we’ve done instead is pull a chart together, based on these assumptions. In theory, it shows how many years you’d need to be investing into the stock market on average until you can retire on a basic income.

If you plan to retire earlier than age 58 – the age our generation can draw on their private workplace pensions and SIPPS from – you will need a big chunk of cash, or more likely, investment assets, to live on.

Here’s the chart, and it shows the estimated number of years to retirement based on the amount you are investing each month into the stock market, starting from scratch:

Years To Retirement by Savings-Per-Month

We’ve assumed zero tax because there are many ways to minimise it such as by using an ISA.

If you are investing £2,000 a month, it means you could retire 15 years from now.

Investing more than this each month has less and less effect on your retirement age if you’re aiming just for a £500,000 portfolio, as after a certain point the bulk of the work is being done by compounding returns, rather than new investments.

Investing £500 a month means you could retire about 33 years from now.

The main thing to do if you want to retire young is to increase the amount you can invest each month as much as possible.

The chart shows that the variance in years is massive at the smaller end of the monthly savings scale – an extra £100 a month could shave a decade off your career.

Our assumptions used the 4% rule to provide an income in retirement from the ISA of £20,000 tax-free.

We’ve shown here how the 4% safe withdrawal rate can be increased by trusting in the stock market, so maybe you could retire earlier than our cautious estimates.

People used to a £38,000 salary should be able to survive on a £20,000 after tax income in retirement, if we follow the 70% rule which says that people tend to need less money when they’re retired than during their working years.

This rule was made for old age retirement, but it could apply here too – but in reality, if you’re retiring young you may want to spend more on freedom activities.

But, consider that you won’t need to save for your retirement anymore, once you’re retired – and monthly savings would probably have been a big part of your budget if you’re retiring early.

Retirement Age And Career Choice

Finally, does your career affect the age you retire? Well, manual labourers tend to retire earlier than office staff, despite pay being typically lower.

This is more to do with being forced to retire early for health and productivity reasons than because they have saved more.

But maybe it shows that office staff could retire earlier than they do, if their blue-collar friends and neighbours are able to, and not be ruined by it.

Also, the pension age isn’t the same for all jobs.

The armed forces can draw a pension at age 60; police, firefighters and sports professionals from age 55.

So, maybe if you want to ensure your work boots are hung up for good by your mid-50s, and you’re good at rescuing cats from trees, maybe it’s time for a career change.

Don’t Be Average

The take-home lesson here is ‘Don’t Be Average’.

Average people retire in their mid-60s, at or close to the state pension age, and have little in the way of investments or private pension pots.

Make sure you subscribe to our YouTube channel below for regular videos aimed at UK investing and financial freedom, and check out the articles and features here on moneyunshackled.com, starting with this guide on matched betting for a way to increase your monthly income and savings rate by maybe £500 – maybe more!

What do you think is a good retirement age, and what’s your target? Join the conversation in the comments below!

Check out the MoneyUnshackled YouTube channel, with new videos released every Monday, Thursday and Saturday:

Investing In The 2020s: Roaring 20s, or a Lost Decade?

A century ago, the 1920s exploded into a decade of prosperity and excess called the Roaring Twenties. Could we be about to see something similar happen in the 2020s?

The world had just been hammered first by World War 1 from 1914-1918, and then by the 1918 Spanish Flu which killed somewhere between 17 and 100 million people.

It was a period marked by the loss of loved ones, economic hardship, and a stressed-out population in need of a release-valve.

As we head into the decade of the 2020s after coronavirus, many economists are looking at the parallels in the history books with excitement, that the Roaring Twenties might be set to repeat itself.

The 2020s have begun with around 2 million deaths so far attributed to coronavirus worldwide, and lockdowns have caused similar economic harm to what you might expect in war-time.

Here we look at all the reasons to be hopeful that the 2020s will indeed be a new Roaring Twenties.

And then, the alternative viewpoint – that the 2020s will end up being The Lost Decade…

Part 1 – Sunshine and Optimism: The Roaring Twenties

How The Years 2010-2020 Set The Stage

Western economies cocked up in the years running up to the 2008 recession, but the years of financial reforms and political shake-ups that followed it have put us in a good position today to move forwards.

We could hardly go much further backwards – in the UK, real GDP per head in Q3 2020 was no higher than it was in 2004. And remember, Q3 was the good times between lockdowns.

In 2016 Brexit was voted for, and then eventually resolved.

What really matters is what this government and future governments choose to do with their new powers.

Hopefully they make a good job of it and the UK takes a competitive lead in the world in the 2020s.

Whether you believe Brexit was a good or a bad thing doesn’t really matter.  A good poker player will often win regardless of the hand they’ve been dealt.

2020

Then of course, Covid hit. The recession that followed is unique from other recessions, and we should take some relief from that.

In the name of public health, governments took the intentional decision to tank the economy, trusting or perhaps hoping it would come back again when the virus had passed.

Unlike in a normal recession, the locked-down population still want to spend, they have the cash to do so, but are just not allowed to.

Such a thing has never been tried before.

What’s really positive though is that some demand is still there, building up and longing for a spending spree, and will be able to do just that once all our shackles have been removed.

Will the world see a quick rebound, leading into a decade of prosperity?

We Were Due A Big Crisis

As we covered in this article on the upcoming debt crisis, we think the artificial recession caused by lockdowns has popped the bubble of the economic cycle at a time when it was due to be popped anyway.

Asset values, debt and the economy all move in cycles, and with a good run since the 2008 crash, economists were just waiting for the next global event to light the dynamite that had been naturally building up.

Government Policies

We’ve been critical of the furlough scheme, but if lockdowns were necessary, then this scheme was too. While many people lost their jobs, more kept theirs, and these people can now contribute to an economic boom rather than being pushed into the benefits system.

And government policies of endless money printing and dumping cash into the economy is likely to stay in place for some time.

In many ways, debt is now all that keeps the UK economy going.

This ultra-loose monetary policy could support a decade of strong growth, but is also just the kind of irresponsible short-termism that could lead to something similar to the 1929 Great Depression that ended the last Roaring ‘20s. But the going will be good for a while.

Savings And Debt

The national debt should hopefully be manageable if interest rates stay low for the next couple of decades. Let’s hope it does.

But while national and corporate debt has ballooned through the crisis, household debt has actually shrunk. In fact, the average household saved £7,100 in 2020.

If everyone splurges that cash once the economy opens up again, it could be the boost needed for a speedy recovery.

The National Feeling

The cash is there, the government policy and willingness for unfettered growth is there too. But there’s something more emotional going on too.

The impatience to escape from our cages is there, and it’s strong. So much depends on the quick roll out of vaccines though, to catch this wave of confidence before it descends into despair.

Imagine the effect on the culture if lockdowns lasted until summer 2022 for instance.

We’ve been denied the basic human rights of eating together, drinking together, and leaving the house, let alone the country. Even a hug has been made illegal.

Hopefully when this is over, people will want to get out and explore the world, live life to the max, and spend like there’s no tomorrow.

Part 2 – Doom and Gloom: The Lost Decade

Economic Mismanagement

In the UK, the 1920s may have been called Roaring, but they were still very much restrained by government policies.

During the Great war, the UK’s money supply had more than doubled through money printing, much like what we are familiar with today.

So in 1925, the government just cut the money supply in half, which caused a recession in 1926, three years ahead of the Great Depression in the US in 1929.

We’re no fans of the UK’s dependency on the magic money tree, but to cut it off abruptly would result in a Lost Decade.

The immediate risk is that policymakers panic and clamp down on the recovery before it has a chance to turn into a boom – possibly even kickstarting a new Depression.

The government has chosen the solution of printing money, and so must keep doing that until we’re fully past the corona-crisis.

Brexit (Again)

As we said earlier, Brexit can be either good or bad economically depending on what happens next. The government could easily mess it up, or it could set us on a growth trajectory much faster than the EU is able to achieve, bogged down as it is with 27 nations with different priorities.

The double hit of Covid-recovery mismanagement and bad post-Brexit policies could be a vicious cocktail that sets us back a decade.

But get both right, and we’ll have little to worry about!

Ramifications Of Furlough

The scale of the economic mess we saw in 2020 was an opportunity for all the bottled-up crap in the markets to be flushed out in one go.

Allowing inefficient companies and bad systems to die is a natural process that is meant to happen in recessions. Indeed, it’s a big part of why booms often follow them.

Like Australian bush fires that clear the old dead trees to leave fertile ground for a new generation, rubbish companies are swept aside allowing room for innovative upstarts to do the job better.

But Rishi’s furlough schemes and business support packages have had the side effect of keeping zombie companies alive right through this crisis, as well as the genuinely good ones of course.

Psychological Scarring

Another risk is that confidence in the recovery never shows up. Vaccination rollouts may take too long or be ineffective against new strains.

Or enough people may have been so terrified by the news in 2020 that they decide it’s just safer to stay indoors, away from other people and their germs – forever changing their social and economic lives.

This permanent culture shift could permanently leave the hospitality and travel industries at half-capacity.

And of course, the precedent has now been set so that if another virus or strain rears its ugly head in the next couple of years, the policy of first resort will be to shut down again, inadvertently nipping any economic recovery in the bud.

A Tale Of Two Lockdowns

The Lockdown Era has been very different for 2 different groups of people, with a dividing line drawn between the employees protected by furlough or able to work remotely, and the small business owners and the self-employed who have been largely left impoverished.

While most remote working office staff will have seen their savings increase throughout the pandemic – thanks to spending opportunities being limited – this has come at the expense of the entrepreneurs and job-creators in the economy, who enter the 2020s saddled with debts and the risk of bankruptcy.

Investing Through The 2020s

In a Roaring 20s scenario, all asset values would go up, particularly productive ones like stocks and property.

In a Lost Decade scenario, as confidence in business and the economy stagnates, it would be to precious metals and possibly bonds that people turn.

And if a new Great Depression comes along later in the ‘20s as a result of the Debt Mountain collapsing, deflation would reign supreme and cash would have the natural advantage as the main asset class to benefit.

The key is to have a balanced portfolio. We think the 2020s will be good times overall, and we’ll continue to hold a majority of our portfolio in equities like stocks and ETFs.

If you want a diversified portfolio without having to learn how to invest, you could look into robo-investing platform Nutmeg, who do all the work for you.

If you like the look of them, they’ll cancel the first 6 months of management fees if you use the link on the Offers page.

We love equities, but in the current economic climate we’ll continue to protect our downside with around 20% of our portfolios in cash and precious metals. If the decade ends up a write off, we’ll be glad we didn’t go all in.

What’s your outlook on the 2020s? Let us know in the comments below.

Check out the MoneyUnshackled YouTube channel, with new videos released every Monday, Thursday and Saturday:

Why The Debt Bubble Is Due To Burst – Inspired By Ray Dalio

It’s worth understanding how debt cycles work – the periods of time between financial collapses – so that we can predict when the next one will come.

Governments and central banks need to know how to foresee debt crises and plot a successful course through them. For us investors, we just need to know how to take advantage.

The tell-tale signs are all there that we’re heading into the next in a long line of debt crises, with similar events in the run-up mirrored across history.

Whether the Great Depression of 1929, the Japanese bubble bursting in 1988, the dot-com crash of 2000, or the Great Recession of 2008 – all were showing symptoms of a debt crisis long before asset prices plummeted.

So, building on the theories of Ray Dalio, why are we heading into the next debt disaster, and what can we do as investors to prepare?

FYI: Stake are giving away a free US stock worth up to $100 to UK investors who sign up via the link on the Money Unshackled Offers Page. Don’t miss out!

Debt Cycles

An economy’s relationship with debt moves in predictable long-term and short-term cycles. Short-term debt cycles typically run around 12 years in length on average, with a boom-and-bust pattern of affluence and overspending, followed by austerity and bruised consumers sitting on their cash.

Long-term debt cycles run far longer, typically around 75 years, or could run the full length of a country’s rise to greatness through to its inevitable decline.

Long Term Debt Cycle - Source: Ray Dalio

A country like China would sit somewhere there on the rise, with a large but reducing inequality in its population’s wealth gap, and gobbling up credit to build infrastructure and fuel growth.

Ray Dalio puts America and the UK as over the hill, America still near the top with their still booming stock market but relying more and more on money printing to get by.

Deflationary Debt Cycles

In the West, our debt cycles tend to be deflationary, which we’re covering in this article – the crisis causes investment assets to lose value and cash to become a safe haven.

On the flip side, there are inflationary debt crisis, like what happened to Germany after World War 1, where a wheelbarrow of cash was needed to buy a loaf of bread.

Credit

What we think of as money is often not money at all, but credit. You can go into a shop and buy a nice hat with a credit-card.

The shop keeper thinks you have the money, but all you’ve really given is a promise to pay the bank that money later.

When a debt crisis hits and you can’t afford to pay off that card, the truth becomes clear for all to see. That money never existed – and has now disappeared from the economy.

Short-Term Debt Cycles

Credit used correctly is a good thing, and an essential economic tool for growth.

During the good times, people use more and more credit because it makes sense to, since growth opportunities are abundant.

It doesn’t matter that they are racking up debts too, as they can be easily managed. And the banks are all-too-happy to lend money to anyone, as there is good profit to be made from doing so.

Short Term Debt Cycle - Source: Ray Dalio

Above is what a typical short-term debt cycle looks like, taken from Ray Dalio’s book Big Debt Crises.

The bottom axis is in months and runs for 12 years, from the recovery through the bubble phase, to the inevitable decline and debt deleveraging. The red line is interest payments, but the blue line is the main one to focus on; being the total debt as a percentage of GDP.

2020 and 2021 sit in the depression phase after a good second half of the 2010s, leading up to the peak of Debt-to-GDP.

This tallies with the government’s massive printing of money during the corona-crisis.

According to debt cycle theory, we’ll soon enter the phase of the cycle when debt has to be reduced, no matter how painful, as it is unsustainable.

Note that debt typically ends a cycle higher than when it began. Several short-term cycles will balloon into a long-term cycle, starting and ending with economic catastrophes.

Ending Higher Than It Began - Source: Ray Dalio

Why Debt Moves In Cycles: Self-Reinforcing Movements

During the good times, lending gathers momentum like a runaway train that becomes unstoppable – except for a head-on collision into something solid that knocks it off the tracks.

Lending supports spending and investment, propping up asset prices and fuelling incomes.

Bigger asset prices and incomes give banks more confidence to lend even more money, as borrowers have better collateral.

But all the while, debt is building and eventually outpaces incomes. At some point, some event will happen that triggers banks to panic, who reign in their credit lines.

Projects pause; incomes stagnate; outlooks for asset price growth look bleak; bad debts mount; and banks stop lending.

This makes the problem worse, and the debt cycle spirals downward into the end-phase.

How Debt Crises Can Be Managed

There are 5 ways to manage a debt crisis:

#1 – Austerity

Cameron and Osborne tried this in 2010 after the Recession, with limited effect.

The problem with austerity is that it is deflationary and discourages growth at the same time as the debt crisis is already doing both of those things.

It does help reduce debt, but it lowers incomes too, so can be counterproductive.

#2 – Debt Cancellations

Just cancelling the debt is not great, as the lenders lose out and this reinforces a downward spiral of deflation, but the crisis can be so severe that it might be sometimes necessary.

It’s widely believed that this needs to happen to solve the Greek debt crisis in the Eurozone, ongoing since 2009.

#3 – Slash Interest Rates

Slashing rates makes it easier for people to pay the interest on their debts, at the same time discouraging people from hoarding their money in a bank savings account.

In this way it encourages investment into the economy again.

#4 – The Magic Money Tree

The central bank just prints more money.

This only works if the country’s debts are in their own currency, but it does encourage growth and spending in the economy which really does help get things moving again.

But is this storing up a currency problem for a later day?

#5 – Raise Taxes

Raising taxes may be necessary eventually to pay for the country’s debts. But raising taxes whilst in a crisis is a big mistake.

This makes everyone poorer at a time when you need money to flow freely again.

The tax hike doesn’t even help the less-well-off, as the money is not being invested to help people, but wasted on debt payments.

However, this is the inevitable final destination for a country in ever rising net debt.

Long-Term Debt Cycles

Remember that each short-term debt cycle leaves the country a little more indebted than it was before, and after many short-term cycles the problem adds up to result in a mega crash like the Great Depression in 1929.

Many of the levers that were pulled by central banks to resolve the last several short-term crises become less effective each time.

After the 2008 recession, we lowered interest rates to almost zero. Even a decade later, rates have not recovered, so that lever cannot now be pulled again.

And the UK is now in over £2trn of debt – over 3 times higher than in 2008!

Where We Are Now In The Debt Cycle

It has been over 12 years since the start of the 2008 Credit Crunch, also now called the Great Recession.

The UK recovered: unemployment went to historic lows, the banking sector was reformed, and city centres underwent massive renovation projects.

But debt built up, and the kindling of the next debt crisis was waiting to be lit by something, and the coronavirus was more of a flamethrower than a match.

Now, we’ve seen banks pulling low LTV mortgages at the height of Covid.

We’ve seen the Bank of England base-rate slashed to 0.1%, businesses forced to shut down, and people forced to stop spending, taking credit out of the economy.

We believe we’re in the end-phase of the short-term debt cycle.

But as for the long-term cycle, 2008 might not have been the end-phase that some people assumed it was. It was a body blow, but is the knock-out punch still to come?

The levers that were pulled at the time to resolve it have been exhausted and haven’t recovered since.

Austerity has already cut back public spending as much as is politically tolerable; taxes have been raised by stealth to what we feel is the upper limit of what can be tolerated by most families; and interest rates have been slashed to the max.

Perhaps worst of all, the money printing was not rolled back at all over the last decade, and was then increased dramatically in 2020.

There is little room for manoeuvre when the next debt crisis hits. We may be just years away from a full blown 1929 style disaster.

Can Investors Take Advantage Of A Debt Crisis?

During good times of growth and demand, productive investment assets like stocks and property are favoured.

During debt crises, these assets stop being as productive, and money runs into cash and precious metals like gold and silver.

It may be too early to say, but crypto currencies like Bitcoin should logically do well during a debt crisis as well, as they act in many ways like a digital version of gold.

We’ve said before how cash itself should be given respect as an asset class in your portfolio, with perhaps a 10% allocation, and perhaps a further 10% to precious metals, and some of you may even want a small portion in crypto currencies.

During times of deflation, cash is naturally well placed to outperform, as many other assets lose value relative to it.

We’ll still hold the vast majority of our portfolios in well-diversified equities and other productive assets, but to ignore cash and precious metals entirely is to ignore the real risk of a major debt crisis coming down the road.

As long as the government keeps on printing magic money, that day keeps getting closer.

Are Debt Crises Unavoidable?

Almost. As Ray said, lending is never done perfectly and tends to be done badly.

The short-term rewards of funding faster growth with credit helps governments to justify the rising debt, and it is politically more popular to let people have easy credit than to take it away.

What politician would impose austerity and tighter restrictions on the voters during good times, before a crash had even happened?

Are you worried about the debt bubble? Tell us your take in the comments below.


Check out the MoneyUnshackled YouTube channel, with new videos released every Monday, Thursday and Saturday:

How and To Invest In China Stocks From The UK

One in six people on earth live in China, with populations of each of China’s mega regions by themselves the equivalents of other major countries. But their stock market is overlooked by western investors.

In 2020, Chinese companies’ market capitalisations hit $10trn USD, in second place behind America’s $38trn. Despite this, China typically only gets allocated around a measly 5% in world tracking ETFs.

A lot of this is to do with the shadowy way in which the Chinese government controls the stock market, keeping the volumes of shares that are available to foreign investors artificially suppressed.

But with China expected to be the world’s biggest contributor to economic growth through to 2030, it is not a region to be side-lined. But how should you invest in China and ride this wave? Let’s check it out!

Don’t forget to scoop up free stocks, cash and other discounts when you open an investing account through any one of our many partners on the Offers Page. These include Freetrade and Stake, who are giving away free stocks!

Alternatively Watch The YouTube Video > > >

Why You Should Invest In China

China has exploded in the last couple of decades, mostly thanks to the government’s creation of city hubs and massive investment in infrastructure, including skyscrapers, road networks, air and rail transport and massive expansion of factories and fossil fuel harnessing.

And even staunch communists have found a way to embrace capitalism, with American consumer products, internet access and smart devices helping millions to join the middle classes.

China went from a nation of cyclists to the world’s biggest car market in a matter of years, and are now also the world’s largest smartphone market, and set to surpass the US as the world’s biggest retail market by 2021.

Endless Growth

China’s growth is seemingly unstoppable. While the rest of the world embraced recessions in 2020, China went ahead and found the V-Shaped Recovery that had eluded everyone else.

China is expected to be the only G20 economy to grow in 2020.

V-shaped recovery found in China

The global economy is expected to contract by around 4-5% in 2020 according to the IMF – the worst downturn since the Great Depression. China, meanwhile, has bounced back strong.

But despite sweet growth and a strong economy, its stock market remains underdeveloped.

How You Can Invest In China

Investing in China poses a logistical problem. Their government wants to control foreign ownership of Chinese companies, and makes it tough for outsiders to plough money into their stocks.

Of course, this damages China and holds it back, but you can’t expect communists to fully embrace capitalism overnight. They’re slowly getting better at running a stock market, but they have a long way still to go before they reach Western standards.

In their efforts to smush together 2 opposing ideologies, they’ve come up with a complicated class system of shares, with some tightly controlled, and others open to everyone.

The main types, A-shares and B-shares, are the shares of China-based companies that trade on the two mainland Chinese stock exchanges, in Shanghai, and Shenzhen.

A-Shares and B-Shares

Historically, China A-shares were only available to mainland citizens, due to China’s restrictions on foreign investors.

This is still mostly the case, with exceptions now for big institutional foreign investors like banks and fund providers, including our favourite ETFs providers – iShares, Vanguard and Invesco.

These big institutions have something called an RQFII qualification, which allows them to buy A-shares.

The other share classes in theory are open to everyone these days, and can be bought by foreigners, though you may struggle on UK platforms.

These include China mainland B-Shares, as well as H, Red Chip and P Chip share classes which trade on the Hong Kong stock exchange.

ADRs

A modern development is that many of those elusive A-shares can now be bought indirectly through American exchanges, using American Depositary Receipts, or ADRs.

Note however that this is a certificate from a bank that represents the stock you’re buying, not the physical stock itself.

A qualified U.S. bank will purchase the real A-shares from the Chinese exchanges, and hold onto them, but list ADRs for that stock on the NYSE or the Nasdaq – which you can then trade.

One other convenient option you have to get exposure to China is to buy an ETF – more on this shortly.

Some Of China’s Biggest Stocks

The Great Firewall of China has long kept out Western technology companies from getting established within its borders. You won’t find Amazon there, but you will find Alibaba and JD.com.

You won’t find Google, but you will find Baidu. Instead of Facebook and Whatsapp, they use Tencent’s QQ and WeChat.

The point is, these companies are as important for China’s 1.4bn people as the FAANG stocks are for us in the West, and at least the following 3 should make their way into your portfolio in one way or another.

#1 – Tencent [SEHK:700] (Market Cap $416bn USD)

If you’re investing in Facebook for the potential that social technology has to shape the future, then you should want to own Tencent as well.

Facebook serves 2.7 billion people – Tencent similarly serves another 1.2 billion people, with almost zero overlap between the two. A portfolio including both of these giants covers most of the world’s adult population.

Tencent Holdings does not have an ADR listing in America, so look to the bigger platforms like Interactive Investor to buy Tencent shares on the Hong Kong Stock Exchange.

#2 – Alibaba [NYSE:BABA] (Market Cap $495bn USD)

Alibaba is the e-commerce company in China, their equivalent of Amazon as a one-stop-shop for everything.

And similar to Amazon, they are also leading the way with their cloud computing service, Alibaba Cloud.

They also own a large stake in Alipay, a major payment processing service used by 700 million people in China.

If one company personified the Chinese march towards the middle class, it would be Alibaba. You can find it listed on the NYSE as an ADR.

#3 – JD.com [NASDAQ:JD] (Market Cap $73bn USD)

A fierce rival to Alibaba is JD.com, far smaller in market cap but poised to grow, with a logistics and delivery service the equal of Amazon’s.

They offer a same or next day delivery across China, and have similar warehouse robotics and drone technology.

JD and Tencent operate as close partners, allowing JD to use Tencent’s social media apps as part of its shopping network. JD is listed on the NASDAQ as an ADR.

The Risks Of Investing In China

There are risks when investing in foreign countries: currency risk, regulatory issues, transparency, volatility, corruption, and possibility of war, to name a few. China has 3 key risks.

#1 – Political

The shady communist government could nick your money. It’s not likely, but it’s not inconceivable either.

Another way it could upset your portfolio is through its ability to crackdown on companies at will if they step out of line.

This happened to software company Momo in 2019 who had its Tantan dating app forcibly removed from app stores.

#2 – China Has An Underdeveloped Stock Market

But… it is improving, and there has been real progress in the last several years. China itself doesn’t have much of an institutional investing sector, and it’s A-shares market used to be 99% owned by normal people – retail investors – which led to the Chinese stock market behaving like a casino.

Now it is around 18% owned by institutional investors since throwing open the doors to approved foreigners, and is gradually becoming more stable.

This still stands in stark contrast to truly open markets like Hong Kong, the US and the UK, which are dominated by big investment banks.

Institutional investors are less reactive to short-term news, have better analysis tools and move in and out of positions slowly to manage profits, by keeping prices from moving too fast – in this way bringing order to a stock market.

While retail investors often trade on rumours, causing stocks to be significantly under or overvalued.

A study by Bloomberg in 2015 found that more than two-thirds of new Chinese investors failed to graduate high school – many investing with borrowed money based on faith in the government.

#3 – Problems Analysing Chinese Stocks

China has very different reporting standards to the UK and US, so understanding a stock’s balance sheet is trickier.

There is also believed to be a higher potential for fraud in their financial system, so less trust can be placed in a set of accounts.

The Best Way To Invest In China

We believe the best way to invest in China is through an ETF, and to forget individual stocks.

To get proper exposure to the China market, the right ETF can buy you ownership of all major stocks, including A-shares.

The MSCI China Index

There are a great number of ETFs and indexes that focus on parts of China, but this index gives us the full coverage we need.

It covers large and mid-cap China A-shares, B-shares, H-shares, Red chips, P chips and foreign listings such as ADRs. With 714 constituents, the index covers about 85% of the China equity universe.

ETFs that cover this index are few and far between. The cheapest one for UK investors is the Lyxor MSCI China UCITS ETF (LSE:LCCN), with an OCF of 0.29%.

MSCI China performance

Look at that growth. China is classed as an emerging market, but has been significantly outperforming the rest of the emerging markets.

MSCI China momentum

This chart shows that China in blue has much higher momentum behind it than emerging markets as a whole, the yellow dot. A higher momentum means investors are backing China.

The MSCI Emerging Markets IMI Index

Another, cheaper way to get this same coverage is by investing in an ETF which tracks the MSCI Emerging Markets IMI Index.

China makes up 37% of the index, and the China part is an exact copy of the MSCI China Index which we just covered.

The ETF we use is the iShares MSCI Emerging Markets IMI ETF (EMIM), with an OCF of just 0.18%, and a typical spread of just 0.11%.

You may want to hold the Emerging Markets ETF, and top it up a little with the China ETF if you felt like you needed more China in your life!

ETFs and China

Although institutions can buy A-shares, many index providers choose not to include 100% of their value, as A-shares still pose a trust and volatility problem.

MSCI EM Index (China evolution)

It was as recently as 2018 that MSCI started adding China Large and Mid-Cap A-shares to its Emerging Markets and China indices, increasing the holdings by many hundreds.

It is adding them in on a gradual basis, starting at 5% of their market cap in 2018 (being 1% of Emerging markets as a whole), and quadrupling to 20% in 2019, where it sits now (being 4% of the Emerging Markets).

If China becomes a free and open market and A-shares increase to full inclusion in the index, China would make up almost half the value of the Emerging Markets.

What We Do

For now, we feel the risk is too high to excessively ramp up China in our portfolio, and will stick to the MSCI Emerging Market IMI Index allocation, which incorporates the MSCI China index.

Mindful of growth potential, but also of Chinese government shadiness, we like to overweight the emerging markets slightly in our portfolios, which puts China at around 6-7% of the total equity for now.

This will be naturally increased as MSCI adds more A-shares into the index, and as China continues to grow.

How are you investing in China? Let us know in the comments below.

Check out the MoneyUnshackled YouTube channel, with new videos released every Monday, Thursday and Saturday: