
Most investors know that if they build a portfolio of index tracking funds and invest for the long-term, they will retire rich.
Using historical returns as a gauge we can expect to make around 8% per year from such a strategy. Not bad!
But despite this, millions of investors, including us to a certain extent, cannot help but try and beat the market, which usually leads to higher risk and inferior returns.
Picking individual stocks is notoriously difficult and is often time consuming if done properly.
Is there a way of making market beating returns without the effort of scrolling through endless accounts and continually monitoring the news and stock performance?
Here we’re going to build an experimental investment portfolio of 20 stocks by taking a few shortcuts.
The goal is to automate stock picking as much as possible, build a complete portfolio in less than 10 minutes, and remove emotion from our decision making. Let’s check it out…
This portfolio will be built in a Trading 212 Pie using analysis tools found on Stockopedia, specifically looking at Super Stocks.
Stockopedia is a premium analysis, data, and stock screening tool that allows subscribers to narrow down an investing universe of tens of thousands of stocks to a handful that are worth checking out.
Stockopedia doesn’t come cheap though and if you become a subscriber you’ll understand why – it’s awesome!
If you head over to the Offers page, you’ll find a free 2-week trial to Stockopedia so you can have a play, and 25% off the first year should you choose to stick with it. You must use this link to get the offer.
What Stocks To Buy
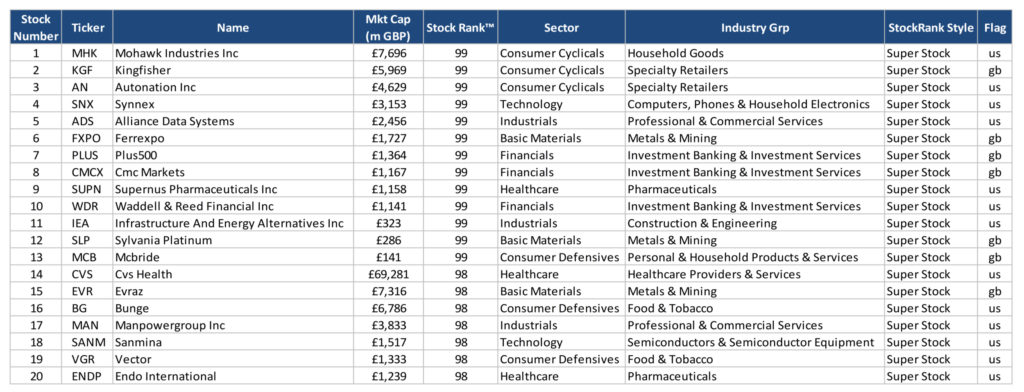
Below are the 20 stocks that we’re buying for this experimental portfolio. All of these have been identified as the best Super Stocks that satisfy our rules-based selection method.
Most of you will probably have never heard of these stocks. But don’t let that put you off. We haven’t set out to build a portfolio of famous brands. We’ve set out to build a market beating portfolio with almost zero effort.
In a bit we’ll look at some of the stocks to get a quick overview of what we’re actually buying.
A StockRank and whether it’s a Super Stock or not can and does change on a daily basis, so we will be regularly updating this portfolio throughout the experiment – we will be looking to refresh the portfolio every few months or so.
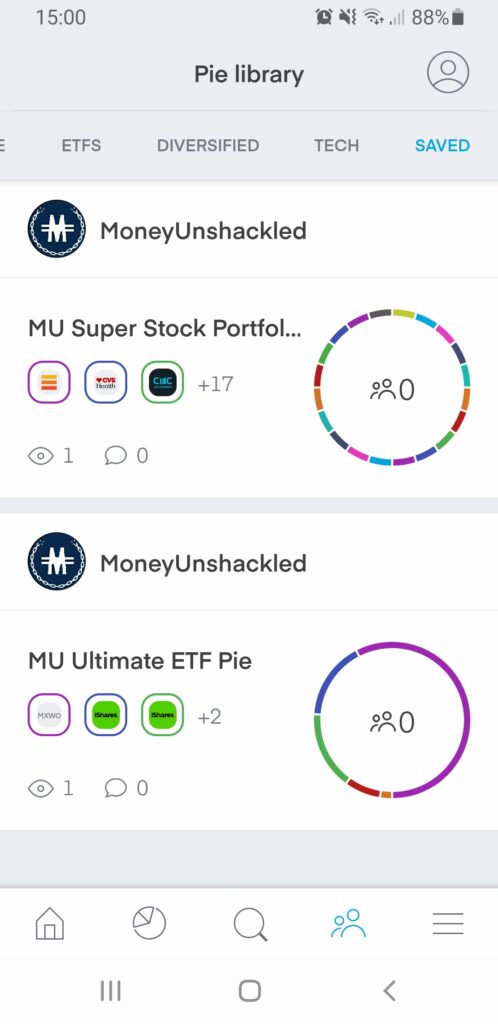
We’ve also shared the Pie within Trading 212, so you can check that out on the app, linked here.
As we’ll be updating the pie on occasion you may want to save it or even copy it if you want to join in with the fun.
While we were at it, we went ahead and created a Pie for the Money Unshackled Ultimate ETF portfolio, linked here, which we talked about in this article. These ETFs make up the core of both of our actual ETF portfolios.
What Is A Super Stock?
Every company on Stockopedia, which is now over 63,000 stocks, is analysed for its Quality, Value, Growth and Momentum across hundreds of fundamental and technical metrics.
They all come together in a set of scores, which Stockopedia call StockRanks.
Subscribers to Stockopedia will see these in the top right of every stock page and they are a fantastic way for investors to get an immediate view of a stock.
Straight away we can see here for Facebook that its Quality and Momentum scores are phenomenal, but investors will have to pay for it as its Value score is in the bottom half of stocks:
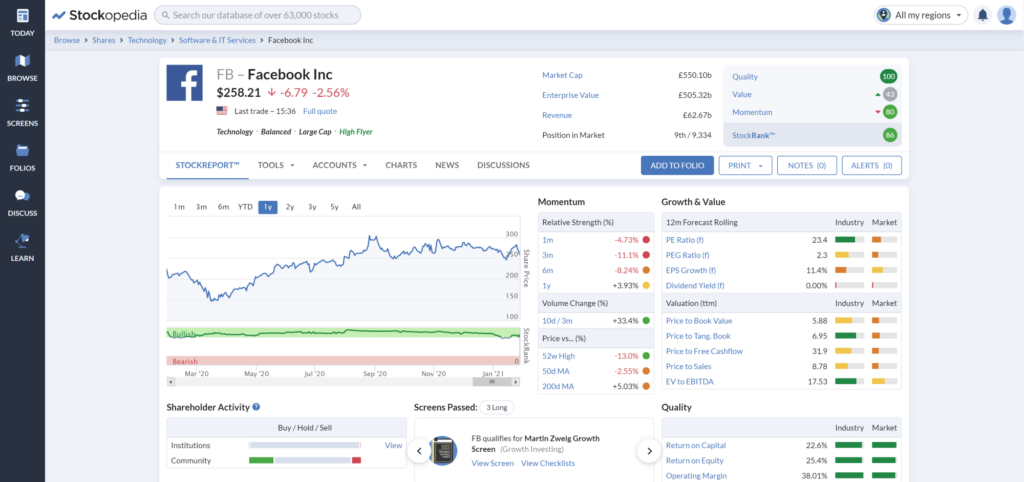
The higher these StockRanks are the higher the probability of success is. Although Facebook looks good, it is not a Super Stock, so doesn’t make the cut in this portfolio.
A Super Stock is where a stock is ranked highly across all 3 Ranks.
Portfolio Rules
We have decided to keep rules to an absolute minimum because we want to test the true effectiveness of Super Stocks, rather than apply lots of subjective conditions.
We’re going with UK and US stocks only because we need to actually be able to buy them, and stocks listed in the UK and US will be the most widely available to us. There’s no point building a hypothetical portfolio that nobody can actually buy.
The next rule we’re applying is a minimum market cap of £50m. We’re going with this number because the bigger the company the more likely it is that the stock will be available on free trading apps like Trading 212, Freetrade and Stake.
In fact, even with a £50m market cap many of the stocks were not available in the Trading 212 pie, meaning we had to omit that stock and move on to the next Super Stock in the list.
We have decided to limit any one sector to a maximum of 3 stocks. We’re limited it to 3 because we want to ensure the portfolio is well diversified.
Without doing this there is a good chance that the stocks would all congregate around a few sectors and failing to diversify is a rookie mistake.
The last and final rule is that the stock must be available in the Trading 212 Pie so we could share it with you guys, but as we discovered this severely limited us in what stocks we could buy.
We applied all these rules and sorted the list from highest Stock Rank to lowest, and then a secondary sort on market cap. We’ll be buying 20 stocks and investing 5% in each one.
Must Use A Commission-Free App
We’re going to chop and change the portfolio frequently, so it will soon get very expensive if you’re paying for each and every trade.
It’s a catch-22 situation. Only the traditional platforms have all the stocks, but their high trading fees means we have no choice but to make do with the commission-free apps instead.
We actually had to cycle through 120 stocks until we were able to build a portfolio of 20 stocks based on our predefined rules.
We had 2 stumbling blocks: The first issue we had was due to our own rule of limiting each sector to a maximum of 3 stocks. Then the second major issue was lack of availability in the Trading 212 Pie.
A Quick Look Inside
We’re not applying any subjective analysis on these stocks for this experiment, but for curiosity let’s take a quick look at a handful of the stocks that made the cut.
Mohawk Industries (MHK)
The stock is US listed and is valued at the equivalent of £7.5 billion. Stockopedia are currently giving it a Stock Rank of 99.
They are a flooring manufacturing company who provide carpets, rugs, tiles, wood, and other flooring products.
Having no prior knowledge of this company and only looking at the StockReport it’s difficult to see why this company is ranked so highly.
It doesn’t look bad by any means but equally it doesn’t set the world alight. Stockopedia’s algorithm must be looking at much more datapoints than we are.
It’s quite cheap, with an EV to EBITDA of just 10.48, and its business doesn’t seem to have been too badly impacted by Covid, with revenue down slightly.
If it wasn’t for this experiment we would disregard this stock – maybe to our disadvantage. But rules are rules, so it gets a place in the portfolio.
Kingfisher (KGF)
A company and industry that we know a little about already. Kingfisher is a home improvement company and is listed in the UK and owns B&Q, Screwfix, and some other brands that we’re not familiar with.
Its revenue hasn’t really gone anywhere in the last 5 years, but it has received a little boost from Covid due to people being stuck at home and doing more DIY.
The company looks to have strengthened its balance sheet with a huge increase in cash and therefore a reduction in net debt.
This looks to be a steady investment that won’t break the bank as the shares are relatively cheap with an EV to EBITDA of just 7.45.
Synnex (SNX)
We’re frequently drawn to tech stocks as they always seem to have the potential for supercharged growth, so a company like this in the portfolio is exciting.
The biggest challenge with tech stocks is understanding what they do.
When reading their business profile, all we see is gibberish, but the company is doing something right as their revenue has been surging over the last 5 years – but a sudden slowdown in 2020 and 2021 is perhaps due to Covid.
We’re not going to spend any time finding out exactly why this is, but it does seem odd – a lot of tech stocks have had super years with businesses rushing out to use the services of tech specialists.
Nevertheless, the company has continued to improve Earnings Per Share, and is forecast to continue doing so.
Surprisingly, the stock is dirt cheap, with an EV to EBITDA of just 4.59 and a PE ratio of just 5.7. It is very unusual for a tech stock to trade at such a cheap valuation.
Stockopedia are putting the technology sector average PE at almost 27, so Synnex could be a hidden gem.
CVS Health (CVS)
We can’t look at all the stocks, so let’s wrap it up with CVS Health. This is the biggest stock in the portfolio with an equivalent market cap of £68 billion.
We really like the look of this stock with its first impression. The company is a US based pharmacy business with almost 10,000 retail locations.
Healthcare is one of those essential products that is needed no matter the state of the economy and it would seem based on their revenue and earnings that Covid has significantly boosted their P&L.
Price-wise CVS looks cheap. The PE ratio is just 9.5 and its EV to EBITDA is 8.25. The one bad fundamental that stands out is its debt. Its gearing ratios are sky high and its Net debt is 4x operating profits. That would normally be a red flag.
Enhancements
Obviously, what we’ve done today is very basic. You might want to take this idea and add in some additional rules. Perhaps you want to automatically exclude stocks over a certain PE ratio or when debt exceeds X times the operating profit.
Whatever you want, you can do this on Stockopedia, so check them out with our special offer on the Offers page.
Will you be joining in with this experiment, and how well do you think the portfolio will do? Join the conversation in the comments below or over on YouTube.
Check out the MoneyUnshackled YouTube channel, with new videos released every Monday, Thursday and Saturday:


1 Comment
synnex debt to equity ratio is 60.11. For good stock, it shall be <2
Comments are closed for this article!