

2020 has been a year to forget – but on the flip side, stock market performance has been a rollercoaster, starting badly and finishing strongly. In normal times, stock markets are often correlated, which means if one particular region does well, others tend to perform strongly also.
For example, when the S&P 500 powers forward, indexes in Europe, the UK, and elsewhere also tend to do the same, and when the S&P does badly, these indexes also tend to struggle.
This has not been the case in 2020 at all – with an enormous range of performances between and within different asset classes. This has meant some investors have been kicking ass and taking names, whilst others have been left with their head in their hands, wondering why they didn’t diversify properly.
At the end of every year, it’s always a good idea to check your investment performance, and we like to compare it against a reasonable benchmark. There’s no point giving yourself a pat on the back for a 10% gain if the market was up 20%. Something like Vanguard’s FTSE All-world ETF is a good yardstick.
But in addition to this self-review, we’re interested in seeing how other investors have performed – just because we’re nosey!
Interactive Investor have just released what they’re calling the Private Investor Index, which gives us insight into how private investors are faring on that platform. In this post we’re going to look at the highlights of this information and take a quick look at how different asset types performed in 2020.
Interactive Investor is the UK’s second-largest investment platform for private investors and has the biggest investment range that we’ve seen. They have a fixed platform fee, so is amongst the cheapest platforms for investors with larger pot sizes. You can check them out here.
Average Returns
Overall, it seems that the average person didn’t perform well in 2020 with a median average return of just 1.8%.
Although this is low compared with typical stock market average returns, we are actually surprised how high it is because the UK stock market was smashing investor’s portfolios to pieces with dire performance.
The FTSE 100 was down -11.55% on a total return basis in 2020, with the FTSE All Share down -9.82%.
The FTSE is heavily weighted with old-school energy stocks like Shell and BP, and financials such as Lloyds Banking Group and HSBC, so recessions can and clearly have punished UK indexes. On that note, these sorts of stocks could be poised to do well during a recovery and have been doing awesome since the turn of the year in 2021 but that is a story for another day.
We know from other studies that there is lots of home bias with investors, so UK investors have way more UK exposure than what you would get with a global index. However, for the average investor to come in with a positive 1.8% return means that most are at least diversifying into other regions and asset classes, which is good to see.
Investment Performance By Age
Interactive Investor have kindly dived deeper into this analysis and broken performance down by age. And quite honestly, we are very surprised at the number of higher positive returns considering what we just said about UK stocks.
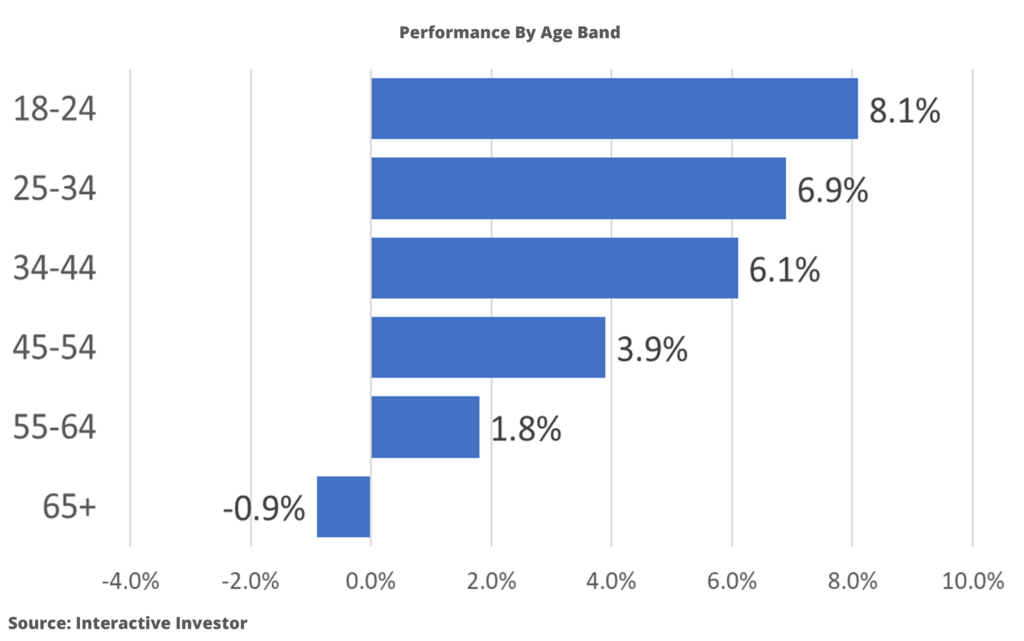
The crown for best age band goes to 18–24-year-olds, who clocked in with a very healthy return of 8.1%, and there is a really interesting trend of decreasing returns with increasing age. This even turns negative for those over 65 at -0.9%.
Interactive Investor’s own analysis of this data suggests that they give the credit of this strong performance by the youngsters to having the largest allocation to Investment Trusts, and further boosted by their overseas and alternative asset exposure.
We don’t talk much about Investment Trusts at Money Unshackled because we prefer passive investments, but clearly Investment Trusts are doing something right, at least in 2020.
According to JPMorgan, 2020 saw the largest ever outperformance of the FTSE All-Share index by investment trusts – the FTSE Equity Investment Instruments Index (FTSE EII) produced a total return of 17.8% vs. the FTSE All Share, which as a reminder was down -9.8%.
Going back to performance by age band, the overall trend of decreasing returns by age comes as no surprise.
Generally, older people de-risk their portfolios as they age because they have less time to recover from any catastrophic collapse in the markets, so are less likely to hold large positions in companies like the FAANG stocks or Tesla, which were stand out performers in 2020.
Older people also grew up in a time when foreign markets were much harder to invest in, so may be more likely to have a UK home bias, even to this day.
Also, we suspect that younger people were better able to take advantage of the extreme volatility that occurred around March time. Younger people are less likely to have existing large sums invested because they have had fewer years to accumulate wealth. So, new money invested for younger people when markets were very cheap will make up a larger part of their portfolios giving them more upside potential.
Conversely, older people would likely have experienced a large decline from the crash caused by Covid and then new money invested would be a smaller proportion of their overall wealth. This is why we don’t really pay much notice to new investors when they brag that they’ve made 25% this year. It’s easy to make big returns on new money.
Type Of Investment By Age
Another interesting set of data provided by Interactive Investor is the type of investment by age band.
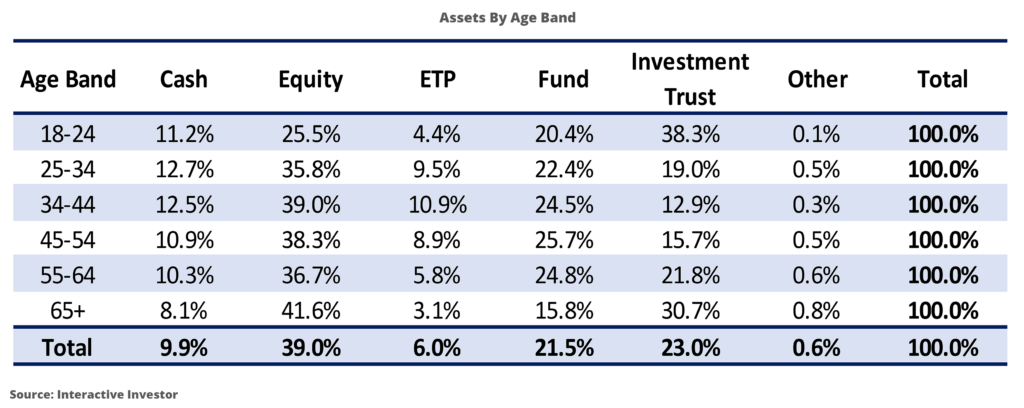
Cash is held at around 10% across the age bands. Interestingly, 10% is the allocation we suggest people hold here at Money Unshackled, so either everyone has been watching and reading our content or this is a coincidence – you decide 😊
Do bear in mind that this is just the assets held within Interactive Investor. Holding cash long-term in an investment platform is not a great idea because no interest is paid.
Moving on to equity, which we assume they just mean individual stocks: surprisingly the young guys have less than old ’uns – a lot less. The over 65s have almost 42% in stocks whereas the under 24s have just 25.5%.
Our best guess is that young people are more aware of the commission-free trading apps and are perhaps more likely to do their stock trading with apps like Freetrade and Stake. Both of these platforms are giving away free stocks when you use our link, so feel free to check those offers out on the Money Unshackled offers page.
ETP stands for Exchange Traded Product and includes ETFs and ETCs. We can’t believe how small a percentage these make up for investors across the age bands at just 6.0%. As far as we are concerned, ETFs are single-handedly the best investment product available. They give huge diversification, at dirt cheap fees, in almost any type of investment.
Funds seem to be evenly liked across the age bands. These often behave similar to ETFs if they are passive funds, but active funds are also very popular, although we don’t see that split from this particular set of data.
What we would have liked to see is funds broken down into more types – whether that be bonds, equity, or mixed, and whether they were active or passive.
Performance by Wealth
II have promised more analysis by wealth in the future, but for now they’ve said that the wealthiest customers on the platform (meaning £1 million+ accounts) made their presence felt with average gains of 8.7%.
This sounds like it might contradict what we said earlier about existing investors having taken large hits from the Covid crash. However, it is highly likely that someone who has built up an investment pot of over £1m knows a thing or two about successful investing or has outsourced it to a professional.
Active vs Passive
We all know that passive investing over the long-term is best, don’t we? Or is it? Well, in 2020, it seems that accolade goes to active investors, who Interactive Investor are defining as those who trade at least twice a month.
These active investors grew their portfolios by 6.3%, which smashed the 1.8% average.
Although active investors won this round, many studies have shown that a passive approach does perform best on average over the long-term, and we might chalk up 2020 as being an unusual year.
Battle Of The Genders
Men or women? Who’s best? We’ve looked at this fight before when we looked at ISA statistics but now II have chipped in and given their two pennies’ worth.
Men win this round with a 1.8% return vs. 1.4% for women.
This comes despite the fact that women had more investment trust exposure than men – 27.5% for women versus 20.7% allocation for men.
Who’s The Best: Regional Returns
Are Southerners better at investing than Northerners? Well, in 2020 they were. Londoners earned a decent return of 2.94%, which smashed the returns of the North West and North East at 0.17% and 0.26% respectively.
But the real investing champions were the Scots, who put us all to shame with a return of 3.22%.
Those in the Channel Islands beat everyone with a return of 4.56%, but with a population smaller than most towns we’re disqualifying them for not fielding a full team.
Asset Types: The Good And The Bad
Looking at total returns in pounds from another II article, the best performing stock market was China with an absolutely phenomenal return of 25.5%. Not bad considering the US has been stealing all the limelight for stock market gains.
The US has of course been doing very well themselves with the S&P 500 up almost 15%, and the Emerging Markets up about the same.
If you’ve seen our video on the Ultimate ETF portfolio you might recall that we’re going quite heavy on all 3 of these regions, because we’re expecting strong returns here for years to come.
And right near the bottom is the UK – but this could be a quick turnaround in the near future due to Covid vaccinations rolling out in 2021.
Bonds, whether that’s inflation linked, gilts, or corporate bonds, have all done very well in 2020.
Investors were spooked by the economic harm caused by Covid, and the monetary measures taken by Central Banks caused lots of money to flood into bonds and push up prices. It seems unlikely they will do well in the next few years with interest rates looking like they can’t fall any further, but who really knows?
And finally, gold had an awesome year, up over 20%. We never used to be gold’s biggest fans, but with all the debt and money printing that is taking place, we are well and truly converts. That’s why we now say hold 10% of a portfolio in precious metals to help protect the downside.
How have you done in 2020 and what was the main driver of that performance? Join the conversation in the comments below.
Performance data from Interactive Investor
Check out the MoneyUnshackled YouTube channel, with new videos released every Monday, Thursday and Saturday: