3 Super Stocks On Stockopedia For 2021

What’s our number one method of finding winning stocks – stocks that are going to generate double digits returns or more?

You’ve possibly seen us use Stockopedia before to present stocks but Stockopedia is so much more than that – it has a ton of built-in tools which serve you up portfolio-ready stocks on a plate.

We want to know whether the stocks that Stockopedia recommends are any good, because if they are, it would save you a lot of time picking stocks – you’d only have to investigate the highly rated stocks on Stockopedia to find market beating returns.

So, in this video we’re deep diving into 3 of the top-rated Super Stocks on Stockopedia as we enter 2021, using 3 of their most popular selection tools.

We’ll tell you whether we agree that they are worth investing in, and how you can find your own stocks using this ground-breaking service. Let’s check it out!

If you want to have a play around with Stockopedia for free, go to the Offers page for a link to a free 14-day trial. If you find you like the service, those who signed up with our link will also be given a 25% discount off their first year!

YouTube Video > > >

Check out the MoneyUnshackled YouTube channel, with new videos released every Monday, Thursday and Saturday:

Weak Dollar? Buy Buy Buy! – Currency Risk & Investing

The pound has been strengthening recently against the dollar. Or, more accurately, the dollar has been weakening and losing value against most other major currencies, struggling throughout the second half of 2020 and into 2021.

A continued slide could put British investors in hot water – but also opens up opportunities.

But what’s going on? As the world recovers from the shock of Covid, investors are now putting on a brave face and seeking riskier investments away from the safety-blanket of the US dollar, according to the Telegraph.

This has weakened the dollar – a good thing for Brits buying American stocks, which now cost fewer pounds to buy.

And with a Brexit deal now looking nailed down, this should give the exchange rate of the pound against the dollar some stability.

In this article we’ll be looking at how currency risk has a big impact on your portfolio, what makes a currency get stronger or weaker, and where we see the dollar and the pound going from here.

And we’ll look at what you can do to protect your investments!

Stake are giving away a free US stock worth up to $100 to everyone who signs up the link on the Offers page. Be sure to check that out!

What Makes A Currency Strong Or Weak

#1 – Interest Rates

These used to be a big driver of exchange rates, but are probably having little effect right now, with the modern era of close-to-zero interest rates across all developed nations.

If the US were able to raise interest rates, the dollar would strengthen.

#2 – Economic Health

Institutions and banks tend to move invested money out of economies with a bleak outlook, into healthier ones.

The US is in no worse shape than the UK coming out of coronavirus, so this probably isn’t what’s happening now.

#3 – Currency Itself Is A Speculative Investment Class

Traders buy and sell currencies just like stocks. Brokers trade currency based on how they think it will move in the future, which moves the exchange rate.

#4 – Panic and Confidence

At times of panic – war, political upheaval, or plagues roaming the land – investors flock to what they perceive as safe havens. The US dollar is one of these.

When stock markets crashed in March 2020, the dollar got stronger against other currencies. When the panic passed, money flowed back out into the world.

Also damaging confidence are the current money printing programs in the West, the largest being in America.

The US central bank magics money into existence on a computer and buys bonds and other assets in the open market with it, resulting in more cash in the hands of banks, who lend it out.

Thus, more cash dollars end up floating around the economy. This is in addition to the US’s very generous stimulus cheques that have been conjured up for the majority of workers in America. This seemingly infinite supply of US dollars makes them less valuable, and weaker vs other currencies.

Why Currency Risk Matters

Currency risk is the chance of your investments losing money from moves in exchange rates. The share price of a stock you hold can even go up but you can still end up losing money if the currency swings against you.

Currency risk has a big impact on your portfolio, but many investors will not even recognise it as the cause of their poor performance.

You need to be thinking about currency risk when you plan out your portfolio. Even UK stocks are exposed to currency, with around 75% of revenues generated by FTSE 100 companies coming from outside the UK. That’s almost all revenues being in a currency other than the pound.

When exchange rates move, your stocks will either benefit or take a hit. The effect could be small or enormous, depending on events outside of your control.

A Good Century For UK Investors In US Stocks

This chart shows the declining exchange rate between the pound and the dollar since the 1950s – the pound getting weaker and the dollar stronger:

Fig.1 Exchange Rate History GBP to USD

This puts into some perspective the bounce we’re seeing since June 2020.

That strengthening dollar would have had the following impact on a UK investor investing in America’s S&P500 stock index over that time frame:

Fig.2 S&P 500 USD vs GBP chart

We’ve laid this graph out with the S&P500 priced in GBP on the right, being the orange line, and on the left, we’ve taken the exchange rate of 2.8 at the earliest data point – December 1954 – and made sure the axis is 2.8 times higher than the GBP side.

The result is a visualisation to scale of the difference between what US investors would have to pay, vs the ever-increasing price that UK investors had to pay to buy into the S&P500.

Had exchange rates stayed the same as they were in 1954, the GBP line would be equal to the USD line, costing £1,330 instead of more than twice this at £2,750 today.

This means 2 things.

#1 – Expensive To Buy

First, for UK investors buying US stocks at any point in the last 70 years, it was a relatively expensive time to do so.

More recently when the S&P500 crashed in March 2020, at the same time the dollar strengthened against the pound.

This meant UK investors were not buying the bargains they might have thought they were.

The US index fell by 34% between 20th Feb and 23rd Mar 2020 – but, Brits would have been disadvantaged by an 11% fall on the exchange rate buying at this time.

This shows that a stock can be cheap for buyers on one side of the Altantic, but not the other.

When an American YouTuber tells you that a stock is cheap, they mean it’s cheap for Americans!

A foreign currency like the Great British Pound will not be on their radar! Ignore them, and just watch Money Unshackled instead!

#2 – Currency Gains

Secondly, UK investors holding US stocks over the last 70 years would have ridden a wave of currency gains.

In fact, UK investors into the US would have received a double dose of growth over this timeframe.

The US’s S&P500 has outperformed all other major world stock markets since 1990 – beating some, like the UK, by a country mile.

So, owning US stocks would have given you better investments, and growth from the currency movements.

But the exchange rate could have moved the other way, like it looks to be doing now, at least in the short-term.

Impact On Investments If The Dollar Continues To Get Weaker

UK investors could take this opportunity to top up their American holdings before and if the dollar recovers.

For us globalists who already own a wide range of stocks from all countries, not just the US, our non-US stocks may be blown upwards on favourable headwinds as other investors pull money out of the US and store it elsewhere.

Fig.3 MU Ultimate Portfolio geographic split

This by the way, is our actual portfolio equity split, more info on which can be found here.

If you’ve ignored us and built a portfolio solely of UK stocks, your small cap stocks may now perform better from a solely currency perspective, as they have less US exposure.

But as we’ve shown, large caps who make a lot of their earnings overseas in dollars are less likely to benefit.

Impact On Investments If The Dollar Returns To Strength

The most obvious way to restore confidence in the dollar and send it back to strength would be if the US central bank stopped their folly of printing money without limit.

But that is like asking a scorpion not to sting you – as much as it might try not to, at the end of the day, it’s all it knows how to do.

Obviously, central bankers think money printing is necessary, but other experts like Ray Dalio say they’re just kicking a problem down the road. It might be better to take the pain and get it over with.

If the dollar does return to strength, which it probably will eventually because America is such a powerful economy, then you may have wanted to use this time to buy US stocks while they were on sale – relatively speaking.

Should You Fear Currency Risk?

Your time horizon matters. Short-term exchange rate fluctuations can be violent – as we saw around Brexit.

But long-term investors may have much less to worry about – many economists believe that currencies reach equilibrium over time and therefore exchange rate fluctuations tend to balance out.

And we’ve shown how UK investors would have missed out on American growth if they’d worried too much about the increasing buy price.

However, we know from looking at the last 70 years in Fig.1 that a directional trend can become engrained, so let’s now look at your options for reducing or eliminating currency risk.

#1 – Avoid

Just buy UK investments. Hopefully you see the pitfalls in limiting yourself to one market though, and this would not be our preferred way to run a portfolio.

And we’ve shown that avoiding currency risk in the UK market is almost impossible, dependant as it is on the Financial and Energy sectors, both hugely impacted by the US dollar.

#2 – Diversify

Instead of investing in one foreign country, invest in all of them. By owning assets in all currencies, global equities will naturally hedge each other as rising currencies are offset by falling ones.

This method gets our vote.

#3 – Currency-Hedged ETFs

This can be a very cheap and straightforward way to remove currency risk.

Currency-hedged ETFs offset the effects of exchange rates on returns, cancelling out any losses from falling overseas currencies.

Sadly, it also cancels out any win you might have taken from rising overseas currencies too.

As indeed would have happened if you’d chosen to hedge the S&P500 over the last 10 years, instead of accepting the risk and taking the much higher unhedged gains.

Currency Hedged ETFs will usually have the word “Hedged” in their title.

Future Outlook

So which way is the dollar going? The US has said it will keep injecting at least $120bn of credit per month until “substantial further progress has been made” in the recovery – by which it means both full employment, and inflation over 2%.

When this will be is anyone’s guess, and until then the dollar will presumably continue to weaken.

Economist Jim Rickards, bestselling author of The Death of Money, estimates this is 5 years away, which could mean $7trn more money printing still to come.

Wealth manager Iboss said: “We expect the dollar will continue to weaken … because the American government and central bank will continue pumping money into the market to help the economy.”

Another wealth manager Seven Investment Management said the dollar could weaken against the pound in the longer term, regardless of Brexit, and with the rollout of Covid vaccines, money might continue to flow out of safe haven currencies like the dollar.

So it looks like a weak dollar, and bargain prices in the US market, may be around for a while yet.

How do you manage currency risk in your portfolio? Let us know in the comments below.

Also check out the MoneyUnshackled YouTube channel, with new videos released every Monday, Thursday and Saturday:

How Big Should Your ISA Be?| ISA Statistics

ISAs are the main investment and savings vehicle in the UK, and every year gov.uk publish a report that gives us some fascinating insight into the investing and saving habits of the UK as a whole.

Throughout the year, ISA managers send HMRC a wide range of data regarding ISAs and today we’re looking at what was last published by gov.uk in June 2020.

Reading the 33-page report is probably not the most exciting of reads, so we’ll forgive you if haven’t gotten round to reading it yet. But now you don’t need to as we’ve handpicked all of the most noteworthy points and put it into a digestible 10 minute video.  And of course, as we go through we will share our thoughts on each point.

We’ll look at some intriguing data on the number of ISA account subscriptions, the total amounts saved and invested, average amounts subscribed, market values, and how much people save based on their salaries.

We’ve also got savings data by age and gender and more. Let’s check it out…

If you’re looking for the best Stocks and Shares ISA, then head over to the Best Investment Platforms page. There you’ll find a full breakdown of all the major investing platforms in the UK to help you choose the one that’s right for you. Some like Freetrade are even giving away free stocks when you use our link!

YouTube Video > > >

Check out the MoneyUnshackled YouTube channel, with new videos released every Monday, Thursday and Saturday:

The Ultimate ETF Portfolio – Low Fees, Low Taxes, High Returns

We’re always looking to build the perfect ETF portfolio and we think we’ve now come pretty close.

While the overall theme is similar to what we have talked about before, the portfolio has gone through a total makeover – and the end result may surprise you. Spoiler – there’s no room for Vanguard.

In this article, we’re going to share with you the exact portfolio that we’re building going forward.

It’s designed to be simple, low maintenance, low cost, low tax, and extremely transparent, so we know exactly what we’re investing in. Plus, it should be very profitable!

We’ll first look at why there’s no room for Vanguard, and then go through each ETF in turn, why they’re in the portfolio, and their historic returns. Let’s check it out…

All these ETFs are available on Interactive Investor. Anyone signing up through this link helps the website, so thanks in advance.

Alternatively Watch The YouTube Video > > >

No Vanguard

Probably the most surprising part of this ETF portfolio is the absence of any Vanguard ETF. In our mission to simplify the portfolio, drive down taxes and to ensure wide coverage across market cap size we have decided to omit Vanguard completely.

This is despite Vanguard having some of the lowest cost ETFs available. The main reasons we dropped Vanguard are as follows:

Reason #1 – No Synthetic ETFs

Many greedy countries around the world deduct a despicable tax from your dividends called Dividend Withholding Tax. For some countries – but not all – synthetic ETFs allow you to circumvent this tax, giving your returns an immediate boost.

Most importantly, synthetic ETFs manage to avoid US withholding tax, and it wouldn’t be an ultimate portfolio without a large allocation to the US, so it’s crucial to eliminate this unnecessary drag on performance. This cannot be achieved with Vanguard!

Although these exact ETFs are not in the portfolio, the comparison clearly demonstrates the effect of withholding tax on US stocks:

S&P 500 ETF comparison table

With US stocks typically yielding around 2% and a 15% withholding tax applied on this, using synthetic ETF’s should benefit the US holding of a portfolio by 0.3% every year.

Reason #2 – FTSE Indexes

Vanguard track FTSE indexes – in this context, FTSE isn’t referring to just the UK market, but is the name of an index provider for many global indexes.

Tracking FTSE indexes isn’t a problem per se but almost all the other ETF providers track those from MSCI. Therefore, you have far more choice if you were to pick just MSCI-tracking ETFs, which our ultimate portfolio does.

It’s not ideal to build a portfolio mixing index providers because MSCI and FTSE categorise countries differently and also include different market cap sizes.

So, by mixing index providers, you can accidentally double up on certain stocks and countries or miss out on others completely.

For example, if you chose an MSCI Pacific ETF and a FTSE Emerging Market ETF you would have no exposure to South Korea. If you did it the other way round you would double up your exposure to South Korea.

Reason #3 – No Small-Caps

Small-caps have outperformed larger and mid-size stocks over the long-term. If this trend continues you will wish you had allocated more of your portfolio to small-caps, but Vanguard do not have a small-cap ETF.

Also, MSCI and FTSE have different definitions of what is a small cap and what isn’t, so you would duplicate some positions.

Inside The Ultimate Portfolio

#1 – Invesco MSCI World UCITS ETF (MXWS)

The largest position in the portfolio, making up 64% of the equity, is the Invesco World ETF, which tracks the performance of 23 developed markets including the UK, Switzerland, France, Canada, and so on. It has a dominant position in the US at around 66% weighting with the next biggest, Japan, only making up 7.7%.

This might sound like an excessive allocation to the US, particularly if you’ve seen slightly lower allocations from other world ETFs, perhaps the Vanguard FTSE All-World ETF.

This is because this Invesco ETF is just tracking the MSCI developed markets. We will be adding in a dedicated emerging market ETF for that exposure which will bring these developed allocations down for the portfolio as a whole.

Even then though, you might think that’s still excessive to invest so much in the US, but it just reflects the size of the US stock market relative to the rest of the world.

It’s the US where you’ll find the lion’s share of the biggest and best companies in the world – Apple, Microsoft, Google, Coca-Cola, McDonalds, Johnson and Johnson. The list goes on.

So why the Invesco MSCI World ETF? First, it’s a synthetic ETF and so gives us the tax advantages that we already looked at.

It does cost quite a chunky 0.19% but at that price point it’s more important to look at the returns you get, rather than what you pay. Having said this, it’s still amongst the cheapest MSCI world ETFs and has the best returns over the last 3 years.

#2 – iShares MSCI World Small Cap UCITS ETF (WLDS)

This beauty is going to provide the supercharged small-cap growth for the portfolio. We have opted for this ETF to make up 18% of the equity – a lower allocation than the large cap ETF due to the risk but large enough to have a significant positive affect on overall returns.

Where the MSCI world index covered 85% of the market cap of developed countries, this world small cap index covers the next 14%, so combined make up 99% of the market cap in each developed country.

This index is also dominated by US stocks making up 56% of the ETF. Japan and the UK come in second and third with weightings of 11.2% and 6.7% respectively.

This iShares ETF is unfortunately physically replicated, rather than synthetic, so we will be suffering from US withholding tax but at the small-cap end of the market there is less choice.

In fact, there’s only one other ETF tracking the MSCI World Small-Cap Index and that costs a fair bit more. The iShares ETF we’re investing in costs 0.35%.

Nevertheless, despite the hefty fee of the iShares version and likely withholding taxes dragging on performance we would expect this to kick ass over the long term.

#3 – iShares Core MSCI Emerging Markets IMI UCITS ETF (EMIM)

Another area we want to get extra exposure to is the emerging markets, particularly China, as we expect these countries to outperform.

We have decided for our portfolios to allocate 18% of the equity to this ETF – more EM exposure than what you would get from a bog-standard world tracker.

This index is heavily weighted to four countries, which make up around 73% of the ETF between them.

The largest – China – by itself has a weighting of 37%, and we would expect this to continue increasing proportionally as China’s market develops and becomes more accessible.

With the developed markets we chose to use two separate ETFs – one for large caps and one for small caps. We wanted to do the same with the emerging markets for the flexibility but unfortunately, the cost of a small cap emerging market ETF is too expensive with the cheapest costing 0.55%.

Instead, we’re investing in a single emerging market ETF which covers both large and small caps. The iShares Emerging Markets IMI ETF is awesome, and covers 99% of the market cap, which is what the IMI in the name signifies.

This ETF costs just 0.18%, which we think is very reasonable considering the stock markets that it gives you access to.

Precious Metals

#4 – iShares Physical Gold ETC (SGLN) and #5 – iShares Physical Silver ETC (SSLN)

Gold and Silver are real money and have a history of protecting a portfolio against economic turmoil – the kind of turmoil that we seem to be experiencing far too often these days.

When world governments print trillions of dollars’ worth of currency, they are forgetting that fiat currencies like the US dollar, the Euro, and the British Pound are only based on belief.

Investors are choosing to protect their wealth from destruction by investing in precious metals like gold and silver. Stocks tend fall in bad economic times and precious metals tend to rise, therefore contribute to a well-diversified portfolio.

Both these ETCs are low cost with the gold one costing just 0.15% and the silver one costing 0.20%. They provide a cheap way to hold physical gold and silver without having the risk, cost, and upheaval of storing it yourself.

For this portfolio we want 10% of the entire portfolio to be allocated to precious metals, and with gold the default choice and with the most demand we have gone with 7.5% gold and 2.5% silver. We may tweak this percentage over time in line with wider economic factors and trends.

Portfolio Overview

This portfolio has been built by us, for us, and if you plan to copy it you might prefer to modify it slightly, so it meets your needs. Some of you might like to add in Bonds for example.

Or use these ETFs as a baseline that you build upon, maybe adding areas you see value in such as the UK market, Oil, Renewable Energy, or whatever else you’re bullish about.

Here is what the portfolio looks like:

Portfolio table

In our portfolios we also like to hold some P2P Lending and Cash.

If you’ve been paying attention and adding up the allocation figures as you went, you might have discovered that they didn’t add up to 100%.

That was because the equity allocations we gave earlier was just for the equity alone. We have opted to allocate 75% of the overall portfolio to equity causing the equity allocation to be reduced overall. Hopefully, that is clear from this table.

The overall OCF comes in at a tidy 0.21% and the portfolio is as tax efficient as we could reasonably make it. Between the 3 equity ETFs, we’re covering 99% of the developed and emerging markets across large, medium, and small-cap stocks.

We also have some flexibility in how much we allocate to each of these key positions, and crucially it is an easily maintained portfolio.

Portfolio Overview – Geographies

Here is the portfolio by region based on the exact allocation we used:

Geographies pie

As we’ve already touched upon it is overwhelmingly weighted towards North America, which is mostly the US with a little bit of Canada.

You’ll notice that the UK is relatively small but as we discussed recently in a dedicated home bias video, linked below, we see no substantial reason to overweight the UK.

If we look at the big countries it looks as we would expect for coverage of the major economies, perhaps with a little too much Taiwan and Korea. But to avoid overcomplicating the portfolio it’s good enough.

Portfolio Overview – Sectors

We’re not too fussed about the sector breakdown as long as it is widely diversified – and as we have built a world portfolio, we would expect this.

Here is the portfolio by sector based on the exact allocation we used:

Sectors table

We’re big fans of technology, so it’s good to see this take up such a prominent position at 20% of the equity allocation. With US tech stocks like Google, Apple and Microsoft so dominant these days this comes as no surprise.

The Energy allocation seems quite low, but this is likely to be due to the time of filming. Covid has caused oil stocks to tank and we would expect these to grow in relative terms as the economy picks back up.

Some people like to hold a substantial property allocation in their portfolios, so with Real Estate making up just 4% of the equity, if you’re one of them, you may want to add in a REIT ETF to increase this.

The Portfolio Historic Performance

History is a decent indicator of what we can expect in the future, but most of these ETFs only have a few years of history.

What we can do instead is look at how the indexes that they’re tracking have performed for as long as we can get hold of data, which varies for each index.

The World index has returned 9.7% annually over the last 51 years. Let’s hope we can see more of this!

The small-cap index has returned 9.5% annually over 20 years. This might look lower than the large caps but if we relook at the World index over the same 20 years, then that has returned 6.4% annually, so small caps have smashed their larger counterparts over the same time period.

The EM index over the same 20 years has returned 9.6%. If these 20-year trends continue then it supports having larger allocations to small-caps and emerging markets as we have done.

And finally, Gold has returned 5% annually over 42 years and Silver has returned 4.7% annually over 53 years, but at times have had decades-long bull markets, which we may be in the middle of right now.

What We’re Doing Now

We both plan to eventually move our ETF positions to this portfolio in its entirety, but this will be done gradually to keep trading fees to a minimum.

What do you think of this portfolio? Let us know in the comments below.

Also check out the MoneyUnshackled YouTube channel, with new videos released every Monday, Thursday and Saturday:

What Investors Should And Shouldn’t Focus on

Investing is a minefield at the best of times, and there are tonnes of potential traps that investors need to watch out for.

How do you pick the best stocks or best funds? How do you build a portfolio that is suitable for you and in line with your attitude to risk? Who can you trust? How can you minimise tax? What are acceptable fees? This list of questions could go on forever.

Rather than come to a grinding halt due to analysis paralysis and end up doing nothing, we’re going to share with you the key areas that we think investors should focus on, and likewise the main noises that you should ignore.

Whether you’re a seasoned pro or an investing noob, there’s a world full of distraction out there and we’re going to cut through the noise.

FYI: The Stake platform are giving away a free US stock worth up to $100 to everyone who signs up via our link on the Offers Page!

Part 1 – Market Noises You Should Ignore

First up, a rundown of the major factors investors should not be focusing on, but which sadly tend to be the only things that many focus on.

Performance League Tables

You’re bound to have seen these before. You’ll find them in financial publications and newspapers.

What you usually see is a big list of funds and their performance over a few different time periods – usually ranked by 3-year performance or something similar.

Performance tables are our #1 biggest annoyance about the investment media, and one of the biggest nonsenses.

First of all, that performance is in the past and may just reflect a confined good or bad period, or fad, or short-term luck. Stock markets often move in cycles and assets, industries and fund managers fall in and out of fashion.

For example, renewable energy and electric vehicles are the craze right now and as a result funds that include them are doing very well.

So, if you were looking at a league table, funds focussing on UK equity, which wouldn’t have exposure to this would reflect badly in the table, but ESG funds would likely be sitting pretty near the top.

Whatever has led those funds to the top of the league table might not necessarily repeat. Track record is useful, but should only ever be used to start research, not conclude it. And a short-term league table is just a vanity project.

Only Looking At The Name

When buying individual stocks, a lot of private investors tend to buy stocks just because it’s a company they’ve heard of or their friends are buying.

If you’re reading about stocks, do you tend to ignore articles on stocks you don’t know and go straight to the big names? Of course! We all do, and we know we’re certainly guilty of this.

The financial magazines and publishers know their audience, which is why in magazines like the Investors Chronicle you have a big page on companies like Vodafone, but some unheard of stock that might be about to set the world alight only gets an inch of column space.

Don’t solely invest in companies just because you’ve heard of them, as a big name doesn’t necessarily mean it’s a good buy.

When we’re picking stocks we tend to use a stock screener like the one found on Stockopedia just to bring back a list of stocks. We may not have heard of these, but this is where the research begins.

Perhaps one way to unearth a hidden gem is to identify a consumer brand that you’re familiar with, and that you think is about to take-off – say Apple.

We picked them randomly, so don’t take that as a stock tip. Then check who supplies them.

Do this with either Apple or Android phones and you’d discover a company called Qualcomm. Now, Qualcomm is no small fry with a market cap of $168bn, but may have better growth potential than the big name brands, and could we well placed to take advantage of the growing list of devices that need processors.

Hot Stock Tips

Never buy a stock just because some guy or some publication said it was a buy. On the odd occasion that we talk about specific stocks, we always caveat it saying don’t buy this unless you do your own research.

One of the main reasons not to invest solely on stock tips is because knowing when to buy is the easiest part. It’s knowing when to sell that is the hard part, and when the profits are made.

For example, a few months back we were very confident with the short-term prospects of Jet2 – a UK airline.

Since we tipped it, for want of a better word, that stock went on return over 100%. Awesome. But how do you know when to sell unless the tipster continues to keep you updated?

On that note, Ben (MU co-founder) sold his position a few weeks back at a handsome profit. That doesn’t mean it’s a sell for you, but it no longer passes his investment appraisal.

Also, have you noticed how most stocks always seems to be a buy and only a handful are a sell?

Nobody except maybe the few people watching or reading who own the stock wants to hear about some company that is in a sell position. Therefore, the journalist or tipster has no reason to write about them.

There are so many buys because tipsters need to tip. Its what gets eyeballs on their content and gets them paid.

We won’t mention them by name but can you think of a particular website that says you’ll make a million pounds if you buy this stock?

They then seem to repeat the same article every day but with a different stock each time.

We’ve had great feedback by people saying how well they’ve done with the stocks we’ve mentioned and asking us to do more of this, but we won’t until there’s a stock worth talking about.

News

Listening to the news is such a tricky one. If you’re going with a passive index investing strategy, then you can ignore the news completely and your returns will probably be better because of it.

This is because the news is overly negative and fearmongering, again because that’s what sells. Presenting the world as a terrifying place grabs their audience’s attention, and keeping eyeballs on their content gets them paid.

Nobody would tune into the news if all they said was everything is ticking over nicely. But people do tune in when it’s some scandal, or catastrophic collapse in the economy, or some terrorist attack.

Ignoring the news might work fine for a passive strategy, but when picking stocks, you obviously need to know as much as you can about the company and the risks it faces.

Here you will have to just fine-tune your own news filter, and work out for yourself what matters and what is just noise.

Part 2 – What You Should Really Focus On

League tables, big names, pundit tips, the news cycle… all are recipes for disaster for long-term passive investors. If you focus on the following instead, you can cut through the noise and find real, sustainable returns.

Fees

In our opinion fees are one of the most important factors to consider. And you need to minimise them! Which is why if you watch our channel you will have seen how committed we are to slashing costs.

Between platforms, funds and market factors, fees can decimate returns.

For instance, a £30k investment over 30 years earning 8% will result in £272k profit.

The same investment but only returning 6% due to all manner of fees will only result in £142k profit. That’s almost 50% less! Fees. Matter.

In the past we have said that we think robo-investing is good for those who don’t want to manage their own portfolio.

The odd person has commented saying the fees are higher with robo-investors than do-it-yourself platforms, but our response to this is that you need to balance the fees with the amount of effort you need to exert and the knowledge you have.

We could save money by installing our own bathrooms, but it’s not the best use of our time as we don’t know how to do it and the builder can do it better. However, we do pick our own investments as we do know what we’re doing there and know how to slash fees.

So, fees should be kept as low as reasonably possible. Investment returns are variable and not guaranteed – but fees are certain, so it’s a definitely a focus area.

Taxes

We are obsessed with taxes or rather, paying as little as legally possible.

You should never let taxes stop you from investing, but rather should arrange your investments in a way that maximises after-tax returns.

This is often by reducing tax, but not always. Sometimes the tax matters less than the investment’s overall potential.

For example, when someone from the UK invests in US stocks, dividends will be subject to a 15% withholding tax. This on average works out to be an effective drag of about 0.3% per year, as the S&P 500 yield is around 2%.

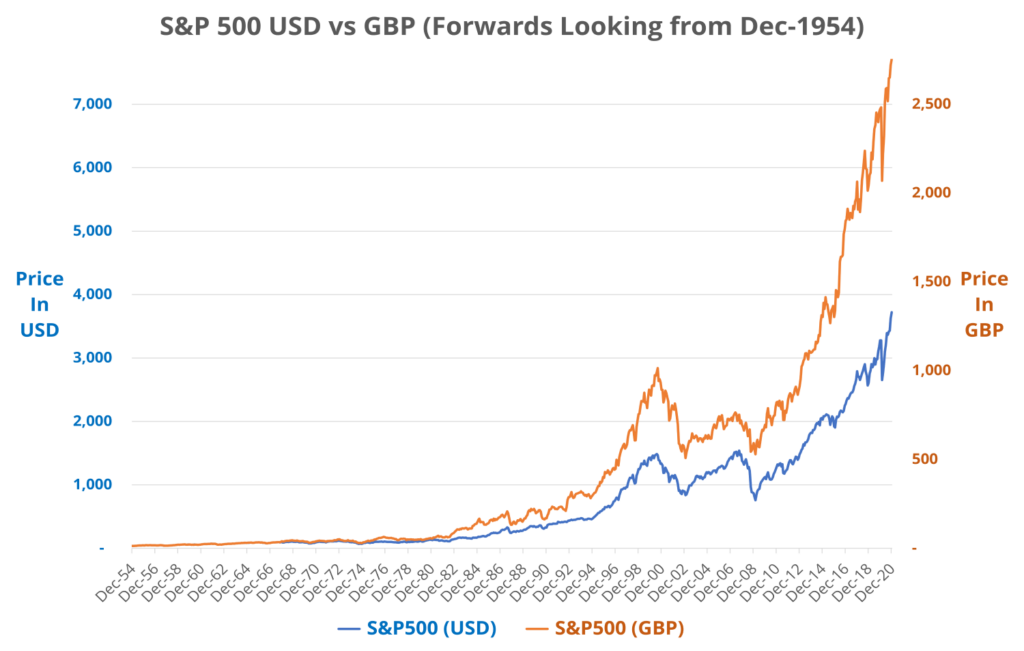
While this is less than ideal, it would have been a terrible mistake during the last few decades to avoid US stocks and instead choose stocks from more tax friendly jurisdictions. Historically, US stocks have smashed other stocks markets. Therefore, focus on overall after-tax returns!

Risk

It’s okay to miss out on the mega returns if those stocks or investments are not suitable for your risk tolerance.

You will of course have seen most of the internet bang on about stocks like Tesla or Nio but these stocks are also just as likely to experience big drops as they are surges in share price. If you can’t stand the heat, get out of the kitchen!

When you make an investment, it’s important to understand how volatile the price is. Beta is a measure of a company’s stock price volatility relative to the market. By definition, the market itself has a beta of 1.

Tesla, a volatile stock, has a beta of 1.8. What this means is when the market moves by 3%, Tesla might move 5.4% – that’s both up, and down! Conversely, a stock like Proctor and Gamble has a beta of less than 0.4, so when the market moves by 3% P&G might move just 1.2% – less growth, but better in a crash.

Bear in mind betas are based on historical price movements so aren’t perfect, but they be can be a good indicator of how volatile a particular stock is.

Where You See The World Going Long-Term

It’s ok to look at the world around you and point your portfolio slightly towards the direction you think the world is headed in.

For instance, we believe the following to be true about the world today:

  1. It’s getting richer and people are living longer
  2. People are demanding ever greater convenience and smarter solutions
  3. Governments will continue to mess up their economies by printing money and increasing debt

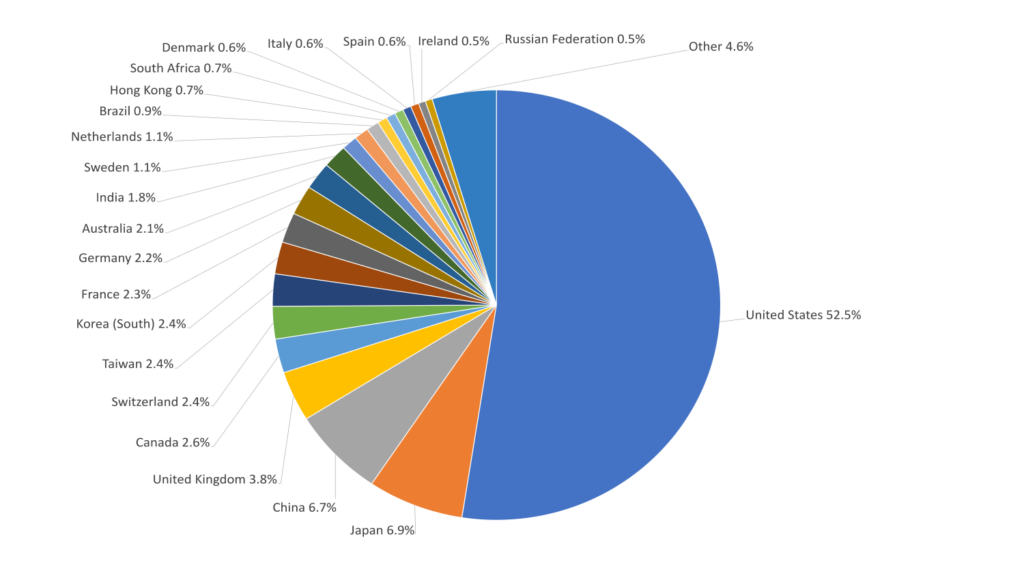
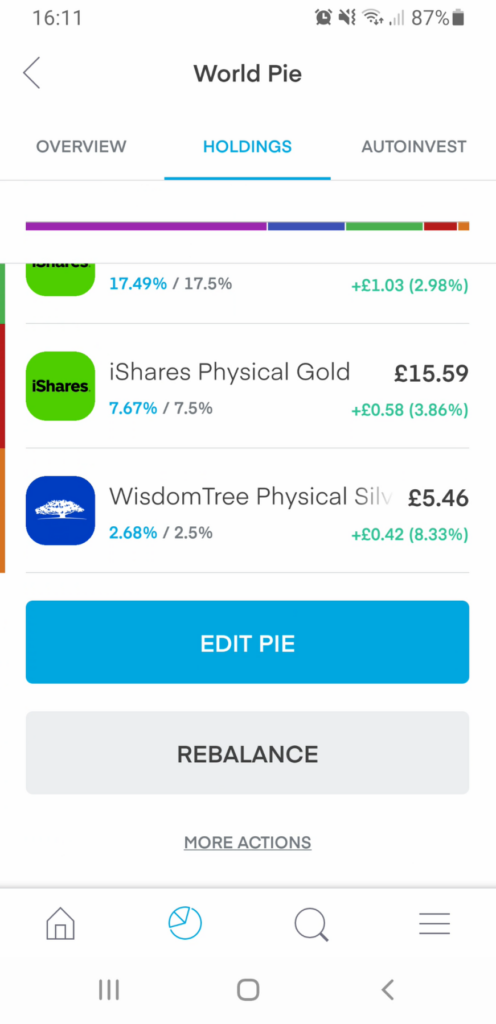
We would always keep the majority of our portfolios as balanced and global, but might take advantage of our long-term outlook by creating small allocations, say 5% to cover each trend like this:

  1. Buy stocks in healthcare companies
  2. Buy stocks in tech companies
  3. Buy gold to protect against economic collapse

What do you think are the most important things to focus on when investing? Let us know in the comments below.

Also check out the MoneyUnshackled YouTube channel, with new videos released every Monday, Thursday and Saturday:

Trading 212 Pie & AutoInvest Review – Best Investing App?

Trading 212 is the investing app taking the UK by storm and for good reason. One standout feature that we love is what they call AutoInvest and Pies, which has raised the bar in what an investing platform should offer.

If the incumbent platforms don’t respond by bringing our similar and equally impressive features, then we predict that they will haemorrhage users to the likes of Trading 212, and we welcome this.

Competition amongst platforms is only good for the customer, so please share this article with all your investing buddies to raise as much awareness as possible.

In this article, we’re going to look at what the Trading 212 Autoinvest and Pie feature is, why you need to be using it and how its features can help you make money, plus we’ll look at some of its problems, and what we’d like to see in future to perfect it. Let’s check it out…

Trading 212 is just one of many platforms – for a full breakdown of all the major investing platforms in the UK head over to the Best Investment Platforms page to help you choose the one that’s right for you.

What Is AutoInvest & Pies

The basic premise for successful investing is that you build a diversified portfolio and invest regularly –such as every month – to average or smooth out your purchase price of your chosen securities.

Every once in a while – perhaps yearly – you should rebalance the portfolio to manage risk and bring the individual holdings back in line with your target allocation.

Doing so should boost investment returns allowing you to achieve your financial goals. At least that is the belief of most investors and what we teach.

While all this sounds relatively easy to do, in reality it’s far from easy and usually quite costly. That is, until Trading 212 revolutionised UK investing – and we don’t use the word revolutionised loosely.

Trading 212 allows investors to custom build a portfolio containing stocks and ETFs by setting an allocation percentage for each individual investment with each investment forming a small part or slice of a wider pie.

Once you have set the percentage allocations the process is fully automated. All you need to do is create an investing plan, where money is deposited into this pie automatically based on the schedule that you choose. This is all done within the app.

Example Pie

You have full control over every aspect of your pie. You can easily adjust the allocation of each individual slice and rebalance with a single tap whenever you want.

You can even tell it how you want any dividend income treated, whether that is to remain in cash or to be reinvested according to your pie’s targets. There is no commitment necessary and you can stop and start investing as frequently as you want.

Why Trading 212

This article is specifically looking at the AutoInvest and Pie feature and is not intended to be a comprehensive review of Trading 212, but here’s a high-level overview.

FYI, this article relates to only their Invest and ISA accounts. They have a separate CFD account, which we are not looking at today at all.

According to financemagnates.com, Trading 212 is now the 2nd biggest UK investing platform by number of users. They offer over 10,000 global stocks and ETFs across a small number of markets including the UK and the US.

Other than the awesome Autoinvest and Pie feature, they also have set the bar high in terms of fees, with zero fees across the board – that is no platform fee, no trading fees, and no FX fees – no fees from them whatsoever.

They also have fractional investing for most of their stocks and ETFs allowing you to buy any pound or dollar amount that you wish.

At the time of filming, we think Trading 212 are the sole major platform offering fractional ETFs – not bad for a free investing app! All this and to top it off the app is clean and easy to use.

Despite all these incredible plus points for Trading 212 there are some potential drawbacks. These include how they are funded, and app downtime.

Firstly, as a fee free app, they obviously need to make money somewhere, and they are believed to be making healthy profits from their CFD platform and channelling this money into building a strong investing app.

The fear is that at some point they will start charging, as obviously businesses aren’t in the business of losing money to make you happy. They’re not a charity.

And secondly, the app has experienced downtime during times of high demand leaving investors unable to trade.

How Other Investing Platforms Have Failed You

Most other investing platforms do offer some sort of regular investing service, but there are many little nagging issues that ruin the customer’s experience.

For a start, other platforms have you specify a monetary amount that is to be invested into a specific stock or ETF, which means you have to do all the percentage calculations yourself – probably on spreadsheet.

Over time it will need rebalancing and you will then have to manually calculate exactly what needs to be sold and bought, which is a pain in the ass and another unwelcome reason to open up that unwieldy spreadsheet.

This is bad customer experience and to top it off you are usually charged for each individual trade, and are therefore more likely to avoid carrying out this proper investing practice in the first place in an attempt to minimise fees.

Revolutionary Features of AutoInvest & Pies

#1 – Set Percentages

All you need to do is add your chosen investments to your pie and move the slider or key in the percentage that you want for each. You don’t need to meticulously calculate how many shares you need to buy based on the share price or set a monetary amount. The clever technology does it all for you.

#2 – Fractions

With the old-guard platforms, you must buy shares and ETFs in full units; 1 share, 5 shares, etc.

When you have a fair bit of money you might think that isn’t a major issue, but when doing automated regular investing it can cause your money not to be invested if the share price moves too high and end up just sitting there in cash, which means your investments will soon break away from the intended allocation.

However, with Trading 212 and fractional trading they use smart internal technology to enable you to own fractions of units, so every pound of your money gets invested.

#3 – Choose Exact Date And Frequency Of Auto Investing

With most platforms that have regular investing you are stuck with the date they choose, which might not be to your liking.

Trading 212 however have not read the rule book and have allowed investors to completely control their deposit schedule.

You can choose the frequency of deposits including daily, weekly, monthly and even less regularly. You can even choose the exact day of deposit. Now that is the control that we like to see. Well done Trading 212!

# 4 – Rebalance With A Tap Of A Button

As mentioned, rebalancing used to be a nightmare – not so anymore.

With 1 click you can see exactly what will be sold and bought, and then another click to confirm. Wait a few secs while this is actioned in the market and hey presto, your pie is back at its target allocations.

Rebalance button

#5 – It’s Free

When Trading 212 first announced Pies we thought it sounded awesome and surely, they would class this as a premium feature that they would charge for. To our surprise it is completely free! At least it is at time of writing in December 2020.

It’s so good we would happily pay for it and it would be a great way for T212 Invest to detach itself from dependence on profits from its CFD arm and operate as a sustainable business model in its own right.

Why Using T212 Pies Helps You To Make Money

The pie feature encourages good investing behaviour and removes restrictions such as cost and inconvenience.

If you’re an experienced investor you will probably already know the importance of diversification and regular investing – and the Pie facilitates it almost perfectly.

Rebalancing controls risk and might also improve returns by selling high and buying low, and is a generally accepted good investing practice.

Also, the automated nature of the Pie removes temptation to deviate from your pre-set strategy.

We know anecdotally that investors struggle to invest in certain assets when they are historically high, but the Pie does it without a second thought.

And finally, we think most beginners will fail to build a diversified portfolio and rebalance, but this app makes it as easy as… pie! Everything is slick and straightforward.

Problems With The Pie

The Pie is pretty damn good but there are some little bugs or things we don’t like that need ironing out.

The Pie’s past performance that gets shown when building and editing a pie is totally wrong (see Image 1 above), because if the ETF inception date is newer than 5 years it messes up the calculation.

Some people may even be basing investing decisions on this, which is dangerous. The app is designed for investing noobies, so when you see the 5-year performance you assume it is true. It’s the only statistic on there and it’s wrong! Also, 5 years isn’t enough time to assess performance anyway.

Further to this, when you set an AutoInvest payment plan it provides you with a value projection based on this same 5-year average, which may look cool, but for the same reasons is total nonsense.

It’s a good idea but the execution needs tidying up. Let’s hope the guys at T212 are reading.

Also, while we like the encouragement of rebalancing with a big button there are no warning signs for noobie investors who may not be aware that you pay a bid/offer spread to the market makers every time you trade.

That’s right, there are still costs to trading even on a free trading platform, as some expenses like the bid/offer spread are outside of a platform’s control. There is a good chance that some investors will be hammering that button daily.

It’s probably not a good idea to rebalance more often than twice yearly. While this isn’t a fee levied by Trading 212 it still is a cost that investors should be warned about.

And annoyingly, not all of the ETFs and stocks are available yet in fractions, which means they’re not eligible for the Pie.

At time of writing, we wanted to buy some iShares Physical Silver but had to make do with the much more expensive WisdomTree version. Hopefully the securities missing will be added in due course.

Potential Improvements

By now you’re probably already sold on what the Pie and AutoInvest has to offer but we have a wish-list of improvements. Maybe if enough people request them, we’ll get Trading 212’s attention.

Firstly, we’d like to have the ability to set a placeholder percentage in the Pie for assets held outside of T212 such as property, P2P Lending or even shares held on other platforms.

This would mean we are building a Pie based on our overall assets, allowing us to better manage our wealth, not just those on the Trading 212 app.

Secondly, it is so close to being fully automated but falls just short of this. To complete it we would like to be able to set the rebalancing frequency to automatically rebalance at a set date, so there’s no need to remember to do it manually.

We would be surprised if this feature isn’t added in due course, at which point it would be fully automated after the initial setup.

And finally, we’d love to see an X-ray feature that analyses the underlying holdings allowing us to see country and sector splits, to eliminate the need for spreadsheets entirely.

What do you think of the Trading 212 Pie? Let us know in the comments below!

Also check out the MoneyUnshackled YouTube channel, with new videos released every Monday, Thursday and Saturday:

How Much Of Your Salary Have You Kept?

Over your lifetime how much of your salary have you kept? It’s a big question and the answer has a lot of implications.

Have you wasted hundreds of thousands of pounds over the years? Have you managed to convert much of what you’ve earned into assets?

If your goal is financial freedom like ours is, maybe you could be much further along the path than you are today if you’d made a point to keep more of what you made.

The average worker will earn well over £1million in a lifetime – and yet most struggle to get by. Does it really cost over £1million to provide food and shelter for a few decades?

Probably not if you stop and think about it. How much of your salary have you kept? Let’s check it out!

It’s worth checking out the Money Unshackled Offers page as we have tonnes of awesome cash bonuses and ways to make money listed that are continually being updated, including how you could make £500+ tax-free monthly from Matched Betting.

Why It’s Important To (Consistently) Keep Money

Work is hard – it’s a struggle that you have to keep getting up for, day after day, week after week, month after month, and you should want to have something to show for all that work.

For us, it’s the knowledge that for every hour of work we do, we continue to get paid after we’ve earned it indefinitely.

We’re talking of course about investing what we keep. For any money that you’re able to keep from your job and invest, you’ll continue to make money from it for the rest of your life.

It’s the Work Once Get Paid Forever mindset that eludes so many people – most of whom work every day and spend every penny.

It’s also important from a practical standpoint to keep more of what you earn. The state pension is by no means guaranteed for our generation.

Planning for retirement used to be a breeze. Invented in 1880 by the Germans, the state pension meant people could stop work at age 70, having kept nothing of what they’d earned, and be supported for life by the state.

This worked well for the Treasury because the average person died at age 38!

State pensions have gotten less generous with time – it’s incredibly costly for the government to maintain and this cost is rising rapidly as people are living longer.

By the time we’re pensioners we expect it will be means-tested, available only to the very poorest of people.

Your Human Capital

We’re going to work out what your value is as a money-producing asset. This is your human capital – how much your time and energy has been worth over your working life.

You’ll might be annoyed with yourself at just how much money you’ve let slip away, perhaps with little to show for it in way of savings and wealth – but it’s largely been beyond your control, as we’ll soon show.

As an employee, the deck is stacked against you, but we’ll get to how you can reshuffle it to your advantage soon.

We’re not minimalists like much of the FIRE community are, but while our focus is on growing our wealth, it’s still true that we should be setting aside as much of it as possible.

That excess money should be being made to work hard for us as financial capital through our investments, so our human capital can put its feet up.

How Much Have You Kept?

Some money has entered your life. Quite a lot of it has left. What you have kept – your net worth – is what you have to show for your efforts.

Your net worth is the value of your assets, minus all debt (except UK student loan debt, which works more like a tax).

Most people have very little savings. The average 40-year-old only has £6,000 set aside. And only 4% of UK citizens invest in Stocks & Shares ISAs.

It should be fairly easy to work out the value of all your financial assets – your cash, your bank and savings accounts, and the current values of your stocks, bonds,  investment property, commodities, plus your private pensions and any other investments.

We looked at the average net worth in the UK and it’s component parts in this video, which showed that around 1 in 5 households shockingly have a negative financial wealth, with more debt than they have cash or investments.

In purely money terms, these people have sadly wasted every one of their countless work hours with less than nothing to show for it. Around the same number of households have no private work pensions either.

The ONS includes the value of all of your assorted junk in their definition of net worth too – your car, your phone, laptops, and everything that’s not nailed down in your house.

But we, and likely you, know better – these things are all expenses. Wealth is no more securely stored in them than it would be by just leaving your cash in the street.

The only physical possessions that represent money kept are items that hold their value like jewellery and art, and your house – which you can include at market value minus the outstanding mortgage.

How Much Have You Earned In Your Life

So, you can easily add up how much you’ve kept – but how much did you earn in the first place?

For most people, what they’ve kept will be a joke compared to what they made – outgoings have a nasty habit of catching up to income.

What You've Earned

Above is a very, very rough approximation of your total take-home pay during your career depending on years worked and headline salary, after deducting tax and student loans, assuming you’re employed.

There’s some pretty chunky numbers there – if you’ve averaged a 35 grand salary over 15 years, you’ll have had around 400 grand enter your bank account.

Where’s that money now? How does it compare to the amount you’ve kept – your money, investments and property?

If you do have investment income alongside a job, don’t include it in this exercise.

Hopefully you’re reinvesting all of that anyway if you’re still working, and we’re just interested in how your blood, sweat and tears from time served toiling the mine – so to speak – translates into saved wealth.

The Question Reworded – How Much Have You Spent?

What You've Spent

Above is what we think a fairly typical 30-year old’s workings might look like. Their after-tax salary, averaging £27,500 over 10 hard years of slog in the office has brought home £222k of bacon.

A 30-year-old might have just climbed onto the property ladder with their partner in an entry level home, with a claim to half of it – offset by a hefty mortgage, of course.

They’ll likely have a small cash buffer and the beginnings of an investment portfolio, if they’re sensible.

Their workplace pensions will have started to build, if only at a snail’s pace, and more than likely they’ll have some credit card debt too – hopefully at 0% interest.

This person would have held onto £30k of the money that they earned – the rest having gone up in a puff of smoke.

Total spending on expenses over the decade was £192,000.

Wow – it’s expensive being human. And to think a cat needs less than a fiver a week to live the dream life.

£192,000 translates to £1,700 per month. It’s not unreasonable to think that at least some of this could be being directed towards investments each month instead.

What You Really Make From Your Job

That imaginary worker on £27,500 a year gross salary has a take home pay of £430 a week.

But he doesn’t really make £430 – there are a whole bunch of work-related expenses that are only incurred as a result of having the job.

So how much of your income gets lost on maintaining a job?

Cost Of Jobs

Above is a reasonable example, inspired by the book “Your Money Or Your Life” by Vicki Robin.

You should knock off an amount for your commute – your petrol, wear and tear on car tyres, train fare, and the coffee you need to buy en route to make the journey bearable.

Then there’s your slave uniform – the clothes you only bought because you were forced to in order to comply with your job’s rules or culture.

Do you sit at your home computer in a full suit and tie? Probably not. But you might need to in the office.

You likely spend more on food when you’re at work – those Pret a Manger’s soon add up.

And the stress of work likely means you need more escapism, with extra holidays and meals out in the evenings to make up for the life you’ve not been living.

And maybe those long hours sitting at a desk are having health impacts that must be remedied with fitness classes and visits to the gym.

We can see that about a quarter of this guy’s earnings have gone on maintaining his job – £120 a week adds up to £62,000 over 10 years.

Think In Terms Of Hours Lost

Think of your outgoings in terms of the hours taken to earn it. Do this thought exercise before every purchase, and allow your default response to be to invest that money instead.

But you don’t just work 40 hours a week. All those job costs have a cost in time too, as well as possibly needing extra sleep on the weekends and time to recover from illness from overwork – like the example shown in the above table.

For this example employee, every £1 spent represents 15 minutes of their life that they had to sacrifice. Or put another way, every hour nets them just £4. Is that new BMW worth 7,000 work hours?

Slash The Biggest Cost

The largest controllable cost you have as an employee is probably your job maintenance cost.

It might be unreasonable to cut your rent or reduce your basic standard of living, but those jobs costs could be mostly eliminated by a permanent move to home-working.

Working from home removes the need for a commute, for a slave uniform, for expensive lunches, and getting rid of the commute alone will probably reduce the need for stress-induced spending splurges, and benefits your health by reducing the time you’re sitting in a vehicle each day.

Much of the country worked from home during 2020 and witnessed these improvements for themselves. It might be in your financial interest to keep this trend going if you can negotiate it.

Break The Time-Link

Your job probably pays you far less than what you’re worth. Are you willing to keep trading your time for a pittance an hour?

We weren’t – so we decided to start earning our money via an asset instead, rather than a salary, by which we mean a business that we own.

Every hour of work that you put into your business makes it a more efficient money-making machine, with efforts increasing scale, and value locked-in and built on.

You can’t do this as easily with a salary.

What’s your age and how much of your salary have you kept? Let us know in the comments below!

Also check out the MoneyUnshackled YouTube channel, with new videos released every Monday, Thursday and Saturday:

Analysing Long-Term Trends With Relative Asset Values – Stocks vs Gold vs Oil vs Property

When investors talk about beating the market, they usually mean picking stocks.

That’s one way to do it, but an arguably safer, more consistent way to do it is to use historic market trends to weight your portfolio towards the asset classes currently in the dips of their long-term value cycles.

All the asset types move in cycles relative to each other on a grand historic scale. Gold for example will spend decades valued highly relative to stocks, only for the pendulum to swing back the other way and become comparatively cheap.

By analysing how asset values have moved against each other over decades, we can see patterns that repeat themselves, and choose to allocate our portfolios more towards assets that are currently cheap.

This is about stacking the deck in your favour. It’s the long-term approach to beating the market. But which assets should you allocate more towards?

Don’t forget to check out the Offers page to scoop up some goodies we’ve collected for you. These include links to Freetrade and Stake accounts, who are giving away free stocks!

Relative Asset Values

Working out if it’s a good time to buy into a type of asset is possible by comparing 2 assets directly to each other.

It’s no good looking at their cash values, as almost every asset type has gone up massively in cash terms over history – so not very helpful for analysis.

That’s because cash is constantly losing value to inflation, exaggerated by government money-printing programs.

But between the other asset classes, the differences in their values change slowly over time as they fall in and out of fashion, and as a result of a gradually changing world.

120 ounces of gold will buy you an average UK house in 2020, but in 2004 you’d need 350 ounces of gold.

There’ll be times when a house could be sold to buy 2,000 shares of X company, and other times that this same property could be traded in for 3,000 shares of the same company – cash values don’t come into it at all.

In this article we’ll be comparing assets against each other to work out which stand to do the best over the next couple of decades – starting with…

Gold vs Stocks

Fig.1 Gold to Stocks

The story of gold is fascinating. Going back 70 years, we see reasonably smooth, cyclical trends going up and down.

Fig.1 is showing a trendline for the value of gold divided by the value of stocks, for which we have used the S&P500 as a proxy for all stock markets.

In 1950 1 Troy Ounce of gold was worth 2 times the S&P500, in 1982 1 ounce of gold was worth 3 times the S&P500, in 2011 1.5 times, and so on.

A reasonable man or woman in the street may have assumed the ratio between gold and stocks would be either a flat line, or a random zig-zag, but what we actually see is a cyclical trend – the ratio moving in decades-long curves.

Gold is currently at a low valuation relative to stocks.

But it’s important to understand the context of what was happening at the time in the world during each dip and spike before we pile our money into gold.

The 50s and 60s saw a recovery after the Second World War with stocks outperforming safe haven assets like gold as economies picked themselves up again.

Then in 1971, President Nixon took the dollar off the gold standard, which had previously fixed the price of gold at $35 an ounce, which explains this sharp spike as gold was let loose to find its own value.

The trend continued upwards during the early 80s, leaving this chart entirely and hitting brief highs of 6.4x in 1980 when high oil prices – another asset – caused high inflation across the world.

Then stocks took over again – the period from the 80s to the millennium was one of strong economic growth.

As you might have guessed, the story of stocks and gold are tied to economic cycles – when we’re in a good period, stocks do well, and when the economic cycle hits a roadblock it’s gold’s turn to shine.

The economy went south again in the years of the last recession, and then stocks recovered for a few years to bring us to today.

Interestingly, the economic brutality caused by the coronavirus hasn’t really appeared on this chart – the data goes up to November 2020, but we can see that the relative value of gold held steady.

We think that what we’re seeing in the chart is another bottom in 2020. The only time gold was valued lower in the last 70 years was during the foolish sell-off of gold by central banks – a policy swiftly halted once they realised that they’d ballsed up big time.

Incidentally, between 1999 and 2002, UK Chancellor Gordon Brown sold 56% of the UK’s gold reserves – at a rock bottom price of $275 an ounce. Gold is now worth $1,800 an ounce.

What a clown. A simple glance at a chart like this would have told him that this was a historically stupid idea.

We think we’re at a point in the gold cycle that if we overweighted our portfolios toward gold, we’d see market beating returns, such as by buying more of the iShares Physical Gold ETC (SGLN).

We’re probably entering one of those periods of the economic cycle where everything goes to hell, starting with the lockdowns of 2020 and the economic chaos that followed.

Gold vs Oil

Fig.2 Gold to Oil

OK, so gold is valued at historic lows relative to stocks. What about oil?

Fig.2 shows the gold price divided by the oil price going back 70 years; the price of a Troy Ounce vs a barrel of Brent Crude. It flat-lined in the years before 1971 because of the gold standard and oil being linked to the US dollar and therefore to gold.

Since the brakes were removed from gold in 1971, we see less of a cyclical pattern, and more of a moving range between 10x and 30x.

If gold was at 30x a barrel of oil, it’d be fair to say that either gold is expensive, or oil is cheap. But look at what’s happening right now at the end of 2020 – the ratio is over 40 times. Either gold is super expensive, or oil is super cheap.

Or maybe the world is moving away from a need for oil. There is widespread belief that renewable energy will make oil redundant.

However, we see this as a slow evolution over many decades still to come.

Gold is not expensive relative to stocks as we’ve proved, so maybe oil is driving this movement.

And we know that the oil price has been massively hit by lockdowns, and will likely rise once economies open up again.

Will oil return to its normal range against gold? History tells us it will, and we should all now be buying oil according to this data, and lots of it.

Here’s an article detailing how we’d go about buying oil.

Is UK Property Expensive?

Fig.3 UK Houses to Stocks

Relative to stocks, it’s a super cheap time to buy residential properties. It’s mostly stocks driving this movement though.

The peaks coincide with economic downturns – the inflation of the 70s and 80s and stocks market crashes of 2000 and 2009 – and the dips with periods of stock market growth.

Fig.4 UK Houses to Gold

We see a similar story though when we compare UK houses to gold. The average UK property is not far away from being worth just 100 ounces of gold.

The periods since 1971 where property was cheaper than this didn’t last long – and pre 1971 was a unnatural time for gold. Nixon really did change everything when he unhooked gold from the dollar.

But it feels like property is expensive, and getting more so. This is because cash is becoming more worthless.

Fig.5 Multiple of Earnings

Fig. 5 shows how house prices since around 1900 have been rising as a multiple of earnings.

What we conclude from this section is that property is cheap, but your wage is not able to keep up!

Small Caps Or Large Caps?

Back to stocks – what analysis can be done to beat the market over the long term? Well, one way is to look at the cyclical pattern of small caps vs large caps.

Small cap stocks are not actually small – Investopedia defines them as companies with values between $300m and $2bn.

But they are much smaller than the companies that make up the S&P 500 for instance, which range from $4.5bn to $2,000bn (or $2trn).

And small caps go through long cycles of over and under performance relative to large caps.

Fig.6 Small Caps to Large Caps (Whole World): 30 years

Fig.6 shows a comparison over the last 30 years, with small caps dipping and then going up fairly consistently relative to large caps.

There’s a dip in 2020 which could be the start of a down-trend, but overall small caps are still relatively expensive in 2020.

Whole-world data was limited for small caps, but we found the following chart (Fig.7) which looks at the top 3000 US companies – comparing the bottom 2000 to the 1000 largest.

Fig.7 Small Caps to Large Caps (USA): Longer Term

The trend from 1990 to 2020 from Fig.6 is visible in Fig.7 too, but prior to 1990 we can see that small caps were doing much, much better – some would cite this as a reason to buy small caps now.

We’re taking a balanced approach with small caps. To us, they look mid cycle.

Going back to the recent history in Fig.6, a lot has changed since 1990 in the stock market that represents a permanent shift, starting with the invention of the internet.

Although they look expensive now compared to the rest of the modern era, a small cap stock can launch on the internet and take over the world in less than 10 years.

Amazon, Facebook and Google didn’t exist in 1990, and are now all among the top 10 biggest companies in the world.

And small caps have shown historically that they can outperform current levels.

What We’re Doing

We’ll hold our small caps position at 18% of our equities – still a large weighting, without going mad.

We’re giving more of a focus to gold and silver in our portfolios. Silver moves in line with gold but with more volatility.

Where before they took up 5-7%, gold and silver now make up 10% and we are thinking about increasing this further – but it’s a difficult decision to commit so much portfolio space to an unproductive asset.

We said back at the start of the first lockdown that the time was right to buy oil, and we think it still is.

We’ll be holding on to our oil stocks and ETFs in the short term until there’s a recovery in the oil price.

The price may be slightly higher now than what it was during the 2020 crash, but compared to long term trends it’s still ridiculously low.

You still need to hold a majority of diversified stock market funds or ETFs regardless of these trends – there’ll always be an exception to the rule.

Owning the world will always be the best starting point, but you can overweight at the edges towards historically cheap assets.

You could take this further and compare other assets yourself, or run a comparison of stock market industries to see if there’s any historical trends worth knowing about. Let us know what you find!

How will you be tweaking your portfolio as a result of these findings? Let us know in the comments below.

Also check out the MoneyUnshackled YouTube channel, with new videos released every Monday, Thursday and Saturday:

Complete Guide To Buy To Let Property

If you have a dream of building a rental property empire, then you’re not alone. There are at least 1 million active property investors in the UK with income from 2 or more houses.

These people are smashing it – why not join them?

In this short guide we’ll cover:

  • how much money you can make from renting out property,
  • the strategy for getting rich;
  • how much it all costs;
  • how to find the perfect rental property;
  • the tax essentials;
  • and more advanced strategies for those building a larger empire.

About once a month we send out the Money Unshackled email newsletter, so if you have not yet subscribed to this, do so! It’s the best way to ensure you don’t miss anything.

Part 1 – Your Returns

Ben (MU co-founder) makes around £325 a month after-tax rental profit on average from each of his properties, based on an average £700 rent.

These properties are nothing special. They are pretty average investment properties; mostly terraced houses in the North. Where he buys, the average upfront investment for a house like that is around £40,000 today.

That’s a cash return of about 10% annually (£325 x 12 months ÷ £40,000). Such high returns are possible because you keep all the rental profit, despite only having to fork out for a small fraction of the property upfront by using an interest-only mortgage.

This is most commonly a 75% Loan To Value split, with you investing just a 25% deposit.

After factoring in the mortgage interest, the effect is roughly a doubling of your cash returns compared to owning the property outright.

On top, you also earn capital gains from property. And this is again magnified by your mortgage.

If you have just a 25% deposit in the house, then a 3% inflationary rise in house prices would give you a leveraged gain of 12% (being 3% ÷ 25%): a 4-fold profit boost. Both profits combined, you’re looking at 20%+ annually.

Part 2 – Your Goal

A goal is a dream with a deadline, and yours should have one. For you, is that 5 houses? 10? 20?

To reach that goal as fast as possible you should keep reinvesting all your cash profits into the next property until it’s achieved.

This means you’ll need to fund your lifestyle through other income sources like you job until your goal is reached.

Part 3 – Can You Afford It?

Upfront Costs

You can buy a decent rental property from around £120,000. Think we’re joking?

In the video version of this guide on YouTube we showcased a perfectly respectable rental opportunity for £120,000 near one of Ben’s goldmine locations in Leeds, that might fetch £650-£700 rent. A 25% deposit on that is £30,000, and stamp duty plus legal fees and minor other expenses would bring you to about £35,000 total investment.

Some people question whether it’s possible to buy such a cheap house, but they’re usually hung up on where they’d want to live, or what they know about their area, rather than sound investment opportunities.

Where you live, property might not be this cheap – so you’ll either have to buy elsewhere and have an agent manage it for you, or simply make sure that the rent you’re getting is proportionally higher. It’s roughly comparable for instance to buying a £240,000 apartment where the rent is £1,300.

Additionally, you may also need to do some initial refurbishment on your new investment to get it tenant-ready.

MyBuilder.com is a fantastic resource for estimating the cost of a project – or to check contractors quotes against, to tell if you’re being fleeced or not – with handy pricing guides for pretty much any contractor work you could think of.

Top tip: for any job that needs scaffolding, add at least £600 to the price!

Ongoing Costs

Your rent should cover these, but what about the times when your house is untenanted?

The tenant is normally responsible for paying the utilities bills and council tax, while you are in charge of paying the mortgage interest, maintenance, landlord’s insurance and safety certificates. On a low-budget investment property, these may respectively cost £120 a month (mortgage interest), £50 a month (maintenance), £12 a month (insurance) and £5 a month (safety certs).

Maintenance

First, don’t do this yourself. You’re an investor, not a toilet fixer!

You should set aside £50-£100 a month from each house into a savings pot to pay for any future maintenance, called a provision.

Ben just had to spend £1,000 to fix a leak in one of his.

Was he bothered? You bet he was. Money is an emotional subject. But rationally, he’d already spent that money months before when he first added it to his provision.

Letting Agent

Use an agent. Don’t try saving every pound by doing it all yourself. Otherwise, your life becomes about other peoples’ problems.

Maybe you start out doing it yourself just to experience the amount of work required; then outsource once the lesson has been learnt.

An agent costs around 10% of your rental income; and means you can treat your investment property like a box on a piece of paper, with money coming in and money going out.

Part 4 – Finding Property

This is easy to do on Rightmove. First up, set up a filter for the house type and price you want to buy. We typically look at 3-bed terraced houses around the £110-£140k range.

Look at a few cities and towns until you find houses in your desired price range.

Then switch to filter for rental property of the same size in that area. Use the map feature on a computer so you can zoom in on specific areas and streets.

If 3-bed houses are getting high rents in the same area as you’re looking to buy, then houses for sale in that area are worth a phone call to the estate agent to book a viewing for.

Part 5 – Your Dream Team

To buy a rental property you will need a mortgage broker, mortgage provider, a solicitor, and contractors to tidy up the house if required.

It’s important you find a good mortgage broker – they don’t need to be local, just highly recommended. They’ll find you the best mortgage, and handle the mortgage provider for you.

The estate agent selling the property can provide you with a solicitor if you don’t have your own – though usually at a premium fee! Contractors can be found at trustatrader.com, or ratedpeople.com.

Part 6 – Tax

The tax rules are unnecessarily complicated for property investors, but be aware that there are 2 sets of rules; one for if you own the properties, and another for if you own a company which owns the properties on your behalf.

We can’t tell you which is best, as the answer will be personal to your circumstances. But generally, if you plan on having a large portfolio of 5 or more properties or you’re a high rate taxpayer, you’ll likely be better off using a company.

Owning through a company has the following rules:

  • A 19% tax on rental profits;
  • To access profits you must pay yourself a dividend, with are taxed at 7.5% for basic rate taxpayers, or 32.5% at the higher rate;
  • Mortgage interest is a valid tax-deductible expense.

Also, not tax related, but mortgage products for companies typically have around 1% higher interest rates than ordinary buy-to-let mortgages.

Owning directly yourself has these rules:

  • You pay tax on profits at the normal 20% basic rate or 40% higher rate of income tax;
  • Mortgage interest is not a valid tax-deductible expense (but you can get a 20% credit against profits).

We think this is a disgusting theft by the taxman – not allowing property investors to offset the largest monthly expense in their profit calculations for tax.

Like much of the tax system, there is no logic or consistency being applied by the taxman here!

Part 7 – Advanced Strategies

House in Multiple Occupation (HMO)

Ben converted his first property to a HMO. It meant he could rent out the property by the bedroom to multiple separate tenants, who share a communal kitchen/lounge area and bathrooms.

Where an ordinary single-let house might fetch £700 rent, a multi-let HMO could bring in £300 a room, across 5 rooms – or £1,500 total. But the landlord pays the utilities, council tax and TV licence.

You’d typically convert lounges and dining rooms into downstairs bedrooms, which could turn a 3-bed into a 5-bed.

From Ben’s experience of managing a HMO by himself – in the days before he realised that time is more important than money – there is no worse way to live than to have to take calls and deal with several peoples’ problems and disagreements 24/7.

Make sure you’re outsourcing the management to an agency.

HMO law has tightened up massively in recent years.

Most cities have an ‘Article 4 Direction’, meaning you must ask permission from the council before you convert a property – with the answer almost certainly being “no”.

Check your city council’s website for where you can and cannot convert – here’s Manchester’s version for example.

The hotspots are typically at the edge of cities, where rent demand is still high but where councils don’t insist on such heavy-handed planning permission.

There are a million other hoops to jump through, including many safety regulations – here’s a comprehensive checklist.

Commercial Property

Investors who’ve built up a decent sized property portfolio might have the financial clout behind them to be granted a commercial mortgage on something like an office building or retail space.

This is a very different market to residential, as your tenants are businesses. The void periods (the name for the time a property is empty) are likely to be longer than for residential houses.

But the range of potential profits are far wider – you might bag a bargain opportunity that makes you your millions.

Development Projects & Flipping

This is another potentially lucrative opportunity you can grasp once you’ve built up several properties’ worth of capital. Instead of buying a nice house on a mortgage, you can buy a horrible shell of a house, and hire contractors to turn it into a very nice house.

You can’t use a mortgage to do this, as a house must be habitable to qualify for one.

So the usual way forward is to both buy the house and pay for the renovation using cash, for which you’d need at least £100,000 at the bottom end of the market.

It’s either that or use expensive short-term debt known as a bridging loan, which we wouldn’t recommend for beginners.

You’d then either sell it on at a profit, called “flipping”, or, get a mortgage on the finished house to extract 75% of the value back into your bank account – and get it tenanted and producing a monthly income!

Are you planning on buying buy to let property? Or do you already have budding empire? Let us know in the comments below!

Also check out the MoneyUnshackled YouTube channel, with new videos released every Monday, Thursday and Saturday:

De-Risk Your Investments While Increasing Returns!

The basic premise of investing is that return is driven by risk: the higher the potential return, the higher the risk must be. This makes intuitive sense, but while it’s true for gambling, it’s not strictly true for all investing.

With stocks, the concept of risk has been muddied with the concept of volatility.

For the short-term trader placing a bet on the stock market, short-term volatility does make that a high-risk strategy. But for the long-term diversified investor, volatility does not translate into higher risk at all.

Here we’re arguing that the stock market is in fact the safest place for your money in the long term… and we’ve got some tips for how you can reduce your risk, without sacrificing any return!

What Goes Up Must Come Down

Every investor is familiar with the concept that the value of their investments might go down as well as up.

It is this fact that terrifies the common man and woman in the streets and keeps them from investing. Or put another way, it keeps them poor.

Why Time Takes The Bite Out Of Stocks

For a short-term trader, the time horizon is small, with the vast majority of the investment’s risk being due to short term volatility.

Remove that short-term volatility from the equation by investing over 30 years, and are stocks still a high-risk investment?

For the long-term investor, the main risk to your finances is not volatility, but the risk of you not hitting your retirement target by having been too cautious.

Look at any 30-year stock market period since the year 1900 and you will see an overall gain.

So long-term investors’ real worry should not be that their equities lose money, as it’s almost certain that they will make money.

Another legitimate risk is that you need access to that money at an inappropriate time, like during a market crash.

But if you have a good-sized rainy-day pot of cash to avoid being forced into selling during one of the market’s frequent low periods, then this risk is removed also.

What’s The Alternative?

We’ve covered many times how the alternative to investing – saving cash in a bank account – is vastly inferior in terms of returns.

As an incredibly brief reminder, once inflation plays its dirty hand, cash savings produce a negative real return; while stocks have always produced a positive one, long-term.

Holding cash makes you poor, in terms of real buying power, which is all that matters. In recent times the loss is around 3% each year; the rate of inflation. This soon stacks up over the years to destroy your position.

When looked at like this, a low or negative return obviously carries its own risk.

It’s far more likely that you will run out of money in retirement, for instance, if you don’t invest – or worse, you never get there because you have to work for decades longer than you wanted to because you didn’t take enough “risk” with your investments.

Low returns actually result in a higher risk to you personally. But high returns can be achieved through low-risk investing – you just need to point your money in the right direction.

How To Dial Down The Risk On Investments

We want a low-risk portfolio that gives us high returns. And we don’t think that’s too much to ask for.

Far too often though, investors are happy to just lower their perceived risk by slashing their returns.

There are profitable ways to lower risk; and there are overly cautious, loss making ways to do it. Let’s discuss these first.

The Wrong Ways To Reduce Risk

#1 – Diversifying With Too Many Asset Classes

Every conventional investing guru will tell you that you should hold a high percentage of bonds in your portfolio – often around 30% or so. Further still, they will probably tell you to also own gold, commercial property, investment trusts, currency, and maybe even crypto.

They advocate this approach because it reduces volatility.

The theory accepts as a necessary cost that some part of such a portfolio should be losing money in the next 12 months, as all assets won’t move in the same way.

But remember, as long-term investors, we don’t necessarily care about volatility – so long as we have a strong enough willpower to stare down any market crashes along the way.

Some of these asset classes are fine additions to a portfolio, and we ourselves own gold and property in addition to stocks.

But these additions are there to boost our returns – not to reduce volatility.

#2 – Focusing On The Wrong Risks

Investors can get hung up on the wrong risks. The main error is focusing on market risk – the risk of short-term losses across the portfolio.

First, you should only be investing money that you can afford to live without, so you can live with temporary losses while you’re building your portfolio.

And second, it is illogical to seek safe harbour in low performing asset classes like bonds or cash to limit losses, as you’re also limiting gains by doing this.

And history shows us that gains always outstrip losses in the end.

Another big worry for investors is currency exposure. But we think currency risk will likely balance out over the long haul, and trying to manage currency risk will often incur fees and produce lower returns long-term.

The biggest real risk you should be seeking to avoid is spending decades on an underperforming portfolio – and consequently retiring poor.

#3 – Reducing Equities As You Age

Most investment advice tells you to reduce equities as you age, to reduce risk (they mean volatility). This is despite equities – stocks, funds and ETFs – being the best performing investments without using debt as leverage. But even in retirement, we want our pots to be growing.

Retirement day is just a day like any other for our portfolios – nothing changes.

A safe withdrawal rate of around 4% can be applied to your equities, allowing you to draw an income and still see portfolio growth.

This is simply not possible if you start switching in large amounts of cash and bonds.

Positive Ways To Reduce Risk

There are positive ways to reduce risk within the stocks asset class, as a higher-return alternative to hiding behind bonds.

#1 – Not All Equities Are Created Equal

You’ll hear the words “stocks are risky” said as though all stocks were the same.

But does a water company carry the same level of risk as a high street retailer?

No – the water company is very low risk because everyone needs water – and water services.

The retailer’s fate is tied to the economy and the whims of fashion – recessions come and go frequently, taking many retailers with them.

We can diversify our portfolios to include lower risk equities instead of relying on low interest bonds.

To see how water has performed as an asset, the iShares Global Water UCITS ETF (IH2O) has returned on average 9.73% annually in the last 10 years – actually outperforming the iShares Core MSCI World UCITS ETF (SWDA) which returned 8.62% annually over the same time frame. Not bad for a low risk asset.

#2 – Dividends

You could also de-risk a portfolio as you approach retirement by moving your investments into high-dividend ETFs and stocks.

Good high-dividend funds can yield 5 or 6 percent, and tend to be more stable companies.

Dividends therefore help you to ride out volatility, though these low growth companies could be a hindrance while you are in the early growth stages of your portfolio.

Furthermore, you don’t need dividend withholding taxes chipping away at your wealth.

#3 – Wide Diversification Within Stocks

While over-diversifying between asset classes can be counterproductive for returns, it’s good to diversify within them.

If you own many thousands of stocks from every corner of the world and every industry, you are unlikely to be in a loss position for long.

As they say, there’s always a bull market somewhere. You’d still need to worry about worldwide market crashes, but only if you needed urgent access to your money.

Crashes tend to resolve themselves within a few short years or less.

What About Rebalancing?

Rebalancing manages the risk of your portfolio drifting away from your target allocations, by selling part of your best performing assets and buying more of the worst performing.

In most years this would mean selling overperforming stocks to buy more bonds.

The jury’s out on whether rebalancing gets you higher returns or not.

Some academic studies show rebalancing gives higher returns, through the act of selling high and buying low – and also through the act of taking small chunks of gains often to avoid capital gains taxes when held outside an ISA.

While others make the solid point that by continually selling winning stocks to buy loser bonds results in a lower return.

One thing it does do, is lower volatility. Remember that volatility and risk are not the same thing for a long-term investor.

Use The Headroom You’ve Built

If your portfolio is risk-efficient, so you are bringing home big returns for a low risk, it might be ok to increase your risk slightly by adding some individual stocks to pursue even higher returns.

Unlike funds and ETFs, it’s not unusual for a stock to double in value in just days.

Using a tool like Stockopedia can help you find well positioned stocks like this, and ones with low risk indicators like low net debt and solid earnings per share growth.

Anyone interested can trial Stockopedia using the link on the Offers page, free for 14 days – and then get themselves 25% off a subscription.

Are you sacrificing return to try and lower risk? Let us know your strategy for managing risk in the comments below!

Also check out the MoneyUnshackled YouTube channel, with new videos released every Monday, Thursday and Saturday: