Best Place To Invest For Retirement

Whether you’re hoping to retire young or at state retirement age, where is the best place to invest for retirement? If you’ve never considered retirement planning properly before or just want to verify your retirement strategy, then this is the blog post for you.

We’re first going to consider what retirement means to you – because it means different things to different people – and then looking at the 5 main vehicles for saving for retirement, including an overview of each one and the cheapest platform to use.

We’ll then look at what makes a good retirement portfolio and finish up with some model portfolios.

Many of the investment platforms we’re about to mention just so happen to be offering free stocks, free money, or discounts when you use the links provided by us. So, before signing up, do check the Money Unshackled Offers Page.

Examples include 6 months free with Nutmeg, or a £50 welcome bonus with InvestEngine, a free stock with Freetrade worth up to £200, plus many more.


Alternatively Watch The YouTube Video > > >

What Is Retirement To You?

Almost everyone considers retirement to be when you stop working at old age – most people are fixated on age 65. Whenever we tell people we want to be retired asap, more times than not they respond by saying, “Don’t wish your life away”.

To them retirement is something that can only be achieved when your best years are behind you and probably when the government dictates it with the state pension.

We’re here to tell you that your retirement can be anything you want it to be, from sailing around the world from age 25 onwards right through to the traditional armchair at 65.

The more you deviate from the so-called norm, the harder it will be of course, but with dedication you can set your own path. You can do so much better than conforming to societal norms.

No matter what age you’re planning to retire, you will need an investment pot that produces an income from the day you stop working to the day you die.

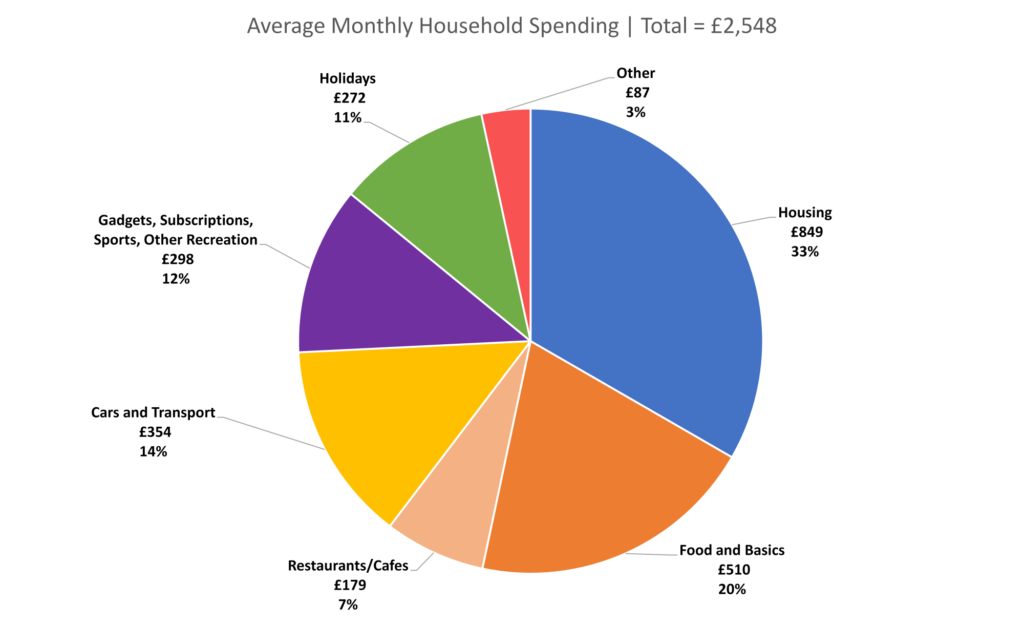
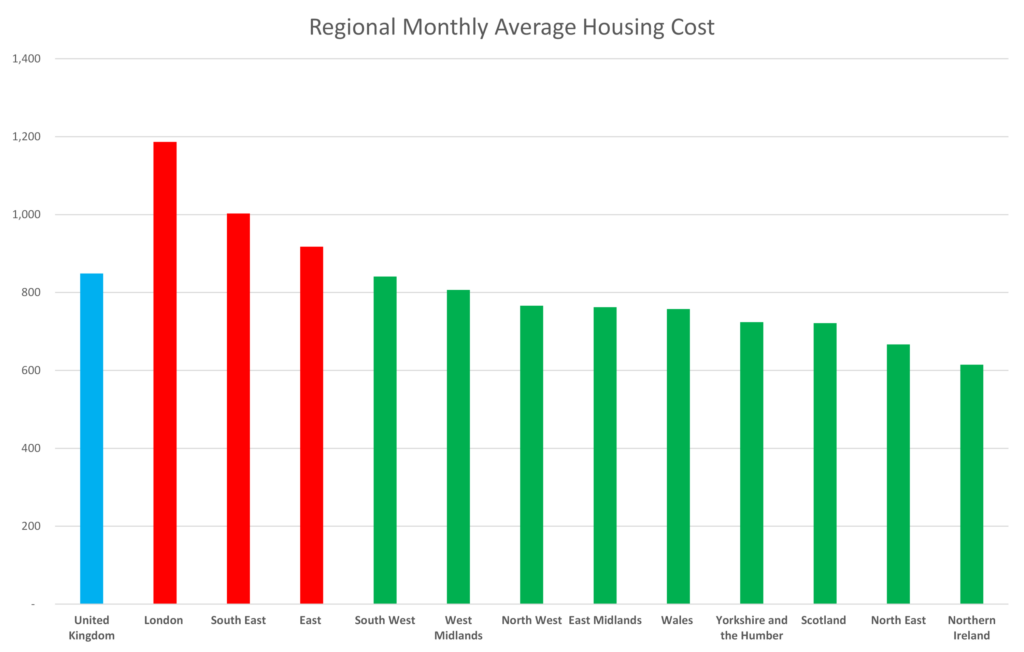
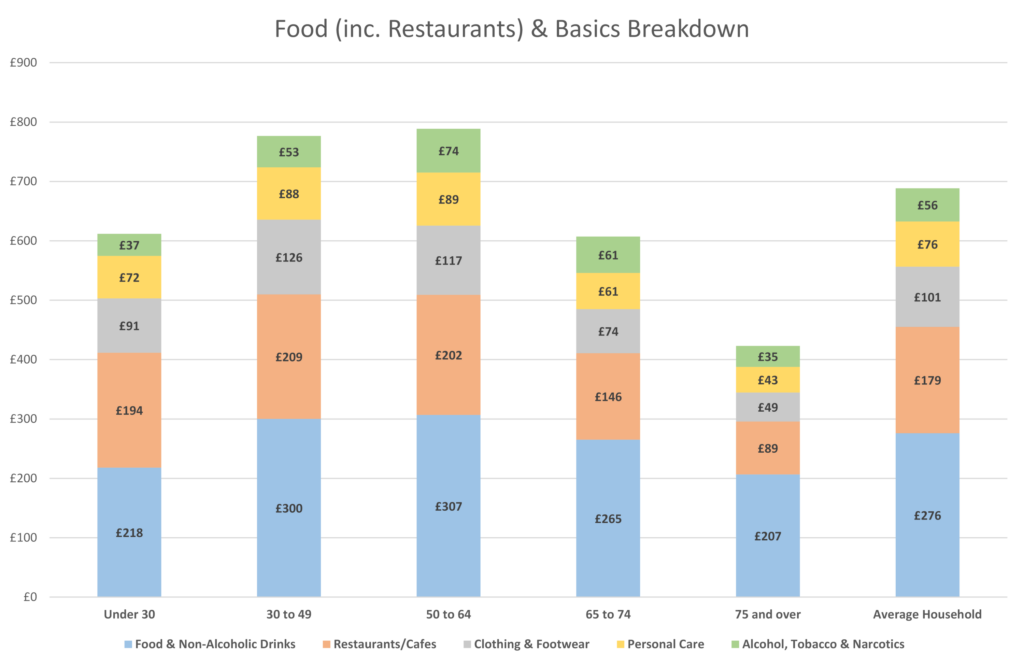
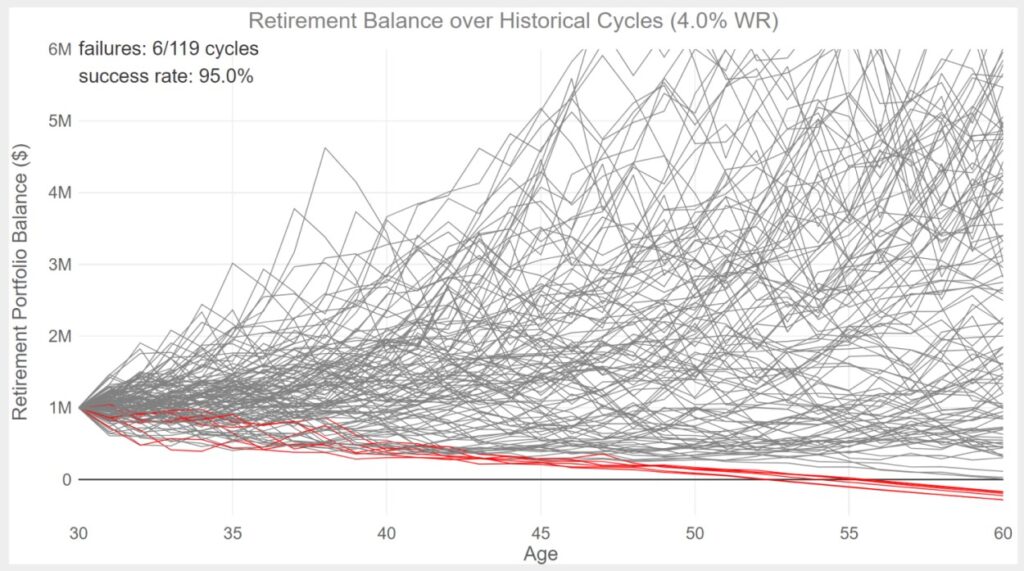
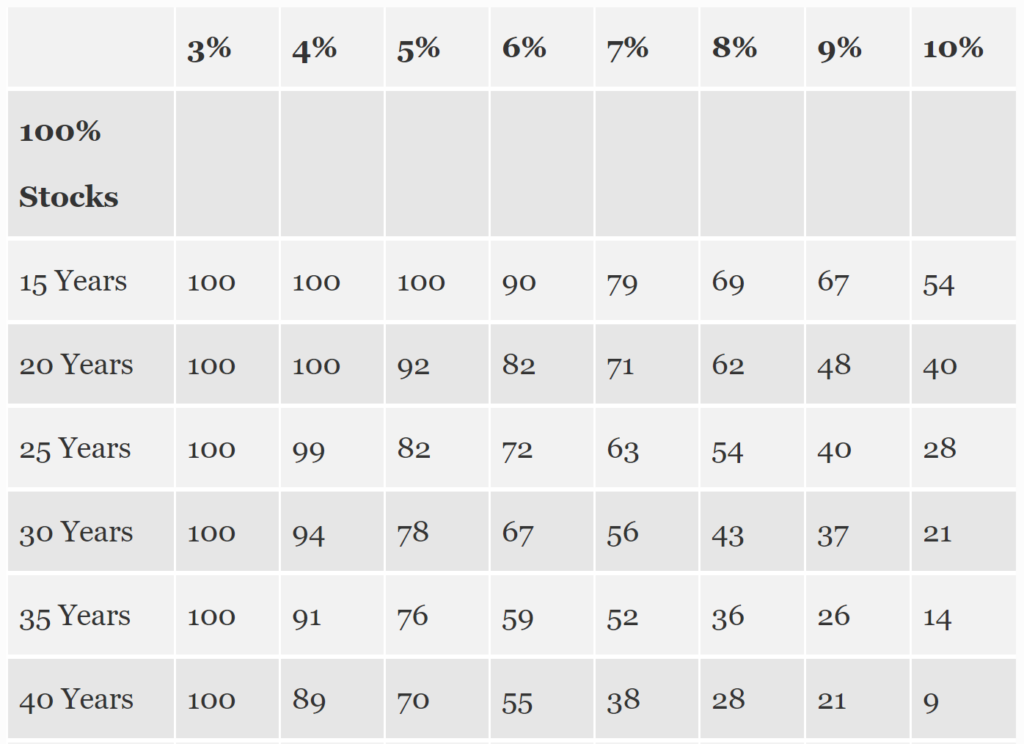
First and foremost, you need to know how big that investment pot needs to be. Work out your expected living costs in retirement and divide it by 4% to give you your required pot size. 4% is generally what is accepted as a safe withdrawal rate.

Check out our other YouTube videos and blog posts as we go into this quite a lot, so we won’t repeat it here. You can lower the percentage if you want to err on the side of caution.

Don’t forget that your expected living costs in retirement might be much lower than they are today. You will have possibly paid down a mortgage, there will be no further need to save for retirement, and maybe the cost of raising children will be in the past.

We’ve built an awesome tool, that will help you determine when you can retire. It’s worth checking that out and coming back to it every so often to monitor progress.

State Pension – Don’t Count On It?

If you’re planning to retire at state pension age, you can also factor that in. The full new State Pension is over £9,000 a year, so could slash your required investment pot.

Check out this video & article if you want to learn more about what State Pension you’ll get.

Our word of warning is that the State Pension probably shouldn’t be relied on, especially for younger generations. Due to the dire state of the UK’s national finances, we expect some sort of means-testing to eventually come into play.

We personally plan as if it won’t be there and hope that it is – and if it is it’s a great little bonus!

If you’re planning to retire young, then obviously you wouldn’t be eligible for the State Pension for potentially decades anyway.

Vehicles For Saving For Retirement

Broadly speaking there are 5 main vehicles that can be used to save for retirement – and when we say save, we actually mean invest.

You cannot save long-term in cash, which includes savings accounts, cash ISAs, Premium Bonds, and so on. Cash has negative returns after inflation. You will have to accept a degree of risk in order to build up an investment pot that is big enough to pay for your retirement.

You should use as many of the following 5 vehicles as necessary. A good retirement plan will likely use most of them and perhaps all.

#1 – Workplace Pension

If you’re an employee or wage slave as we half-jokingly call them your employer must offer a workplace pension where they match your contributions up to a certain percentage. Take advantage of this to the max as it’s essentially free money.

You won’t be able to access this until at least age 55 – and it’s likely to be 58 according to the Government’s current policy. Even for freedom fighters aiming to retire young we would encourage you to fully utilise this, as you can cleverly manage your other retirement vehicles to live on until your pension accounts kick in. Although, we wouldn’t bother paying any more that what your employer will match as there are better alternatives, which we’re about to see.

The downside of pensions is that when you eventually draw an income from them, the amount taken will form part of your taxable earnings.

#2 – Self Invested Personal Pension (SIPP)

This account is very similar to a workplace pension. It will have the same tax benefits and the same access rules –being that your money is locked away until your late 50s.

SIPPs give you a great deal of control over what you invest in. Moreover, SIPPs can be much cheaper than workplace pension schemes if you choose your platform and investments carefully.

SIPPs are great for consolidating old workplace pensions into one convenient place. People now have an average of 11 different jobs during their career, and will often be enrolled into a new pension at each workplace – an absolute nightmare to keep track of.

Before consolidating your pensions though do check if there are any exit fees and/or safe-guarded benefits that you might lose by transferring – most modern workplace pensions will not.

We personally both have SIPPs, which we used to consolidate old workplace pensions, but are not currently adding more money to them as we’re focussing on accessible retirement strategies.

Whatever you pay into a SIPP or a workplace pension will get tax relief. Tax relief is paid on your pension contributions at the highest rate of income tax you pay. So:

  • Basic-rate taxpayers get 20% pension tax relief.
  • Higher-rate taxpayers can claim 40% pension tax relief.
  • Additional-rate taxpayers can claim 45% pension tax relief.

We’d love to do a full run down of the best SIPPs, but time is short, so instead check out the best SIPPs page here.

In summary, for most people Vanguard is likely to be the cheapest, but AJ Bell Youinvest isn’t far behind and gives a significantly wider investment range to choose from.

Freetrade have just launched a SIPP but strangely it’s not as competitively priced as their other accounts. There’s a fixed monthly cost of £10 – barely noticeable on larger pots of perhaps over £50k but not great for smaller retirement pots.

Nutmeg is our favourite robo-advisor SIPP. Their ‘Fixed Allocation’ portfolios cost just 0.45% plus fund fees, and we think this is ideal for anyone who wants an expert to choose their portfolio for them.

#3 – Stocks & Shares ISA

This account type is a beast and is likely to be the main investment vehicle used by those seeking early retirement.

You can currently deposit £20k every year and it’s very tax efficient. We’ve refrained from calling it tax-free because there are some minor taxes you might still have to pay, such as stamp duty and dividend withholding taxes.

The Stocks & Shares ISA is so powerful because you will never have to pay any capital gains or UK dividend tax no matter how large your ISA grows.

Secondly, there are no access limitations. You can literally withdraw whenever and as much as you want, and your withdrawals do not count as taxable income – so, you can probably see why we love Stocks & Shares ISAs so much!

Again, we’d love to do a full run down of the best Stocks & Shares ISAs, but for completeness instead check out the best ISAs page, found here. In summary and only broadly speaking, Interactive Investor is very good for pots over £50k who want choice. AJ Bell Youinvest is an all-round cheap platform with account fees of just 0.25% on funds.

Commission-free platforms include Trading 212 and Freetrade, and for those who want it managed for them, newcomer InvestEngine is an incredibly cheap robo-advisor.

Check out our Stocks & Shares ISA comparison page here for a thorough comparison.

#4 – Stocks & Shares Lifetime ISA (LISA)

This account is surprisingly not talked about that often but could be better than a SIPP for some people. With Lifetime ISAs you get a 25% government top-up on your contributions, similar to what a basic rate taxpayer gets on a SIPP, but just like other ISAs they never incur any further income tax.

Therefore, for basic-rate taxpayers a Lifetime ISA is likely to be financially better than a pension. However, higher-rate taxpayers are probably better off with pensions due to the higher tax reliefs.

Some downsides to the Lifetime ISA include a low contribution limit – you can only deposit £4k a year and this eats into your £20k ISA total allowance.

Secondly, you can’t access the money until age 60, without penalty. This makes it similar to a pension but insanely your Lifetime ISA savings will impact on any welfare benefits you might be entitled to, as the DWP factor Lifetime Isa savings into Universal Credit calculations. For this reason, we would tread carefully using LISA’s.

So, which is the best Lifetime ISA? Unfortunately, there is barely any platform choice. AJ Bell Youinvest is among the cheapest at 0.25% on funds, and Nutmeg is the cheapest robo-advisor that we’ve seen offering LISA’s.

We’ve not yet built a Lifetime ISA comparison page but it’s in the pipeline, so do check back if you’re thinking of opening a LISA.

#5 – BTL Property

BTL property is perhaps the most lucrative investment available to normal working people due to mortgage leverage. The returns can be enormous but there are also a lot of downsides.

Unlike stock market investing you can’t really invest and manage property while you’re taking your morning number two.

The drawbacks include unexpected bills, late paying or non-paying tenants, problem tenants, regulations, organising maintenance with tradespeople, tax complexities, your time involvement, and lots more. If you are able to take all of this on, then absolutely consider property investing.

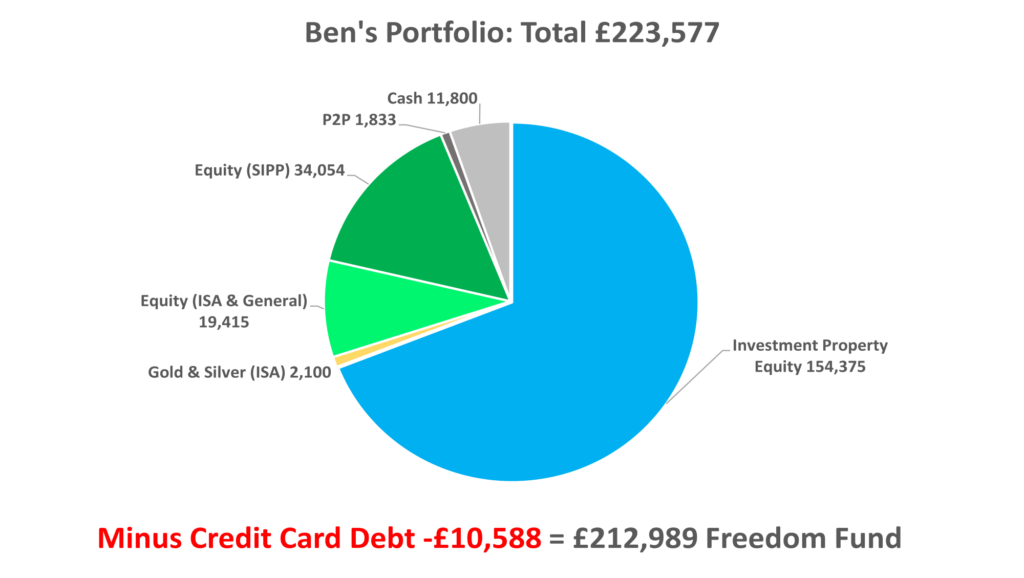
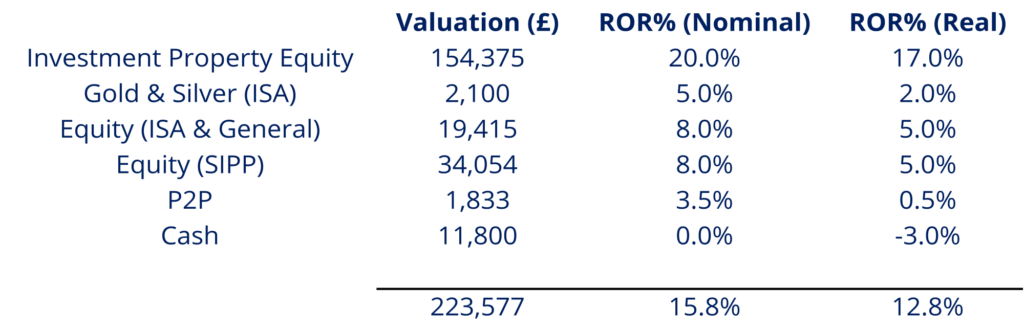
The bulk of Ben’s (MU co-founder) retirement pot is in BTL property and his annual ROI has been around 20% – you can’t get that very easily in the stock market.

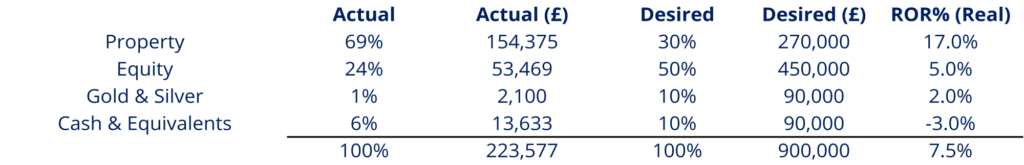
What Makes A Good Portfolio?

Other than the last point on property, all of the best vehicles for saving for retirement are geared towards stock market investing.

If you choose a robo-advisor you won’t need to concern yourself with this but for those going down the do-it-yourself investing route, we think a good portfolio should possess the following characteristics:

  1. Simple – You should have a clear understanding of what you are investing in and keep the number of assets you own at a manageable level. Complexity means higher costs.
  2. Low Cost – Fees matter. Keep them as low as possible. That also means don’t trade frequently as this is a guaranteed way to let fees spiral.
  3. Tax Efficient – Tax is an unwelcome evil. Use all the weapons in your arsenal to minimise it or even eliminate it. Remember it’s the after-tax return that’s most important.
  4. Diversified – Ideally globally and across multiple asset classes. The younger you are the more you can lean towards high-risk assets such as equity funds.
  5. Passive – Active investing incurs lots of fees and is on average unlikely to provide superior returns. Investing passively in an index allows you to invest with conviction. Being free from doubt means you won’t tamper with the portfolio, which usually only damages returns.

Model Portfolios

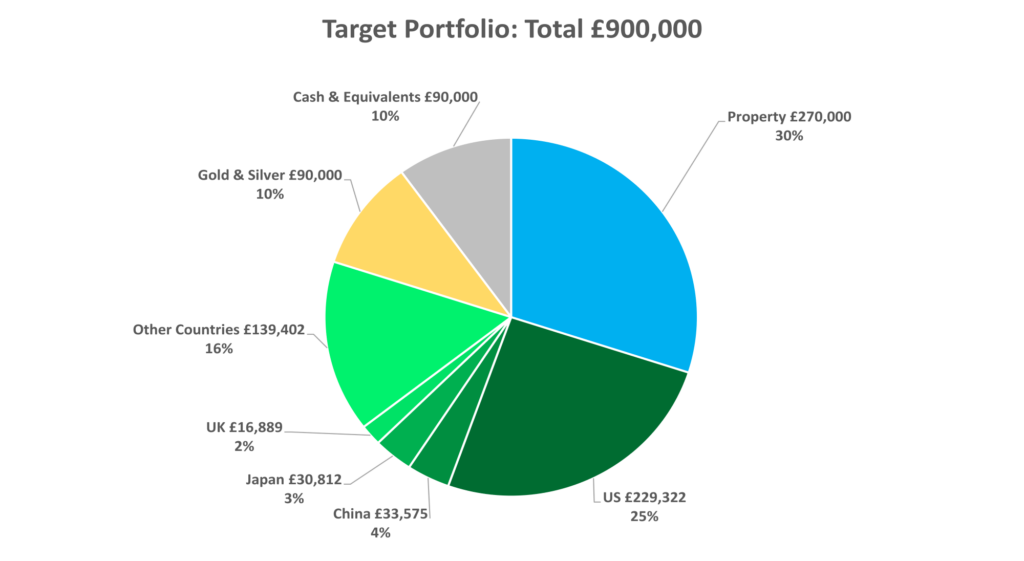
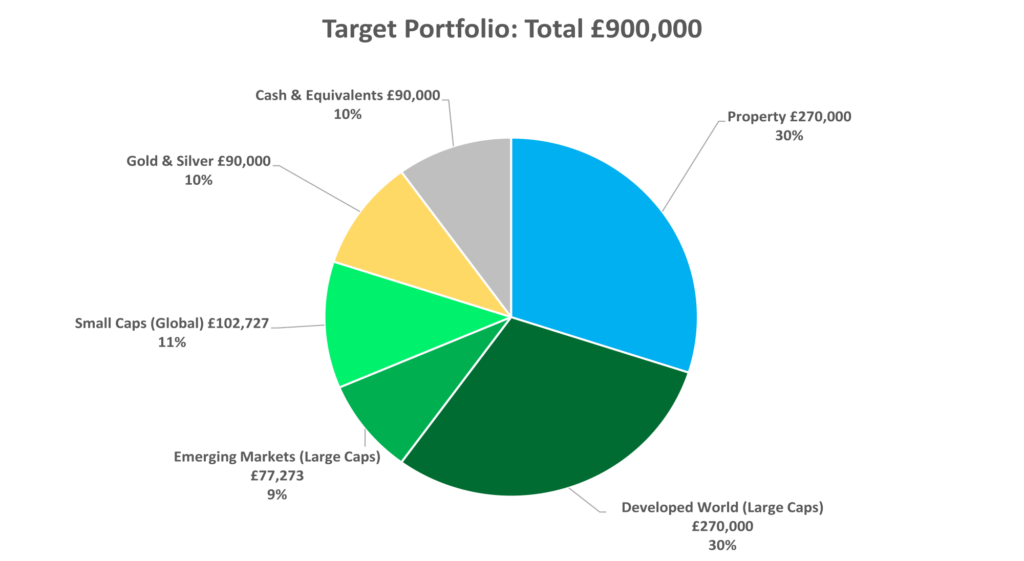
Following the characteristics just outlined, our ideal portfolio is what we’re calling the Money Unshackled Ultimate Portfolio.

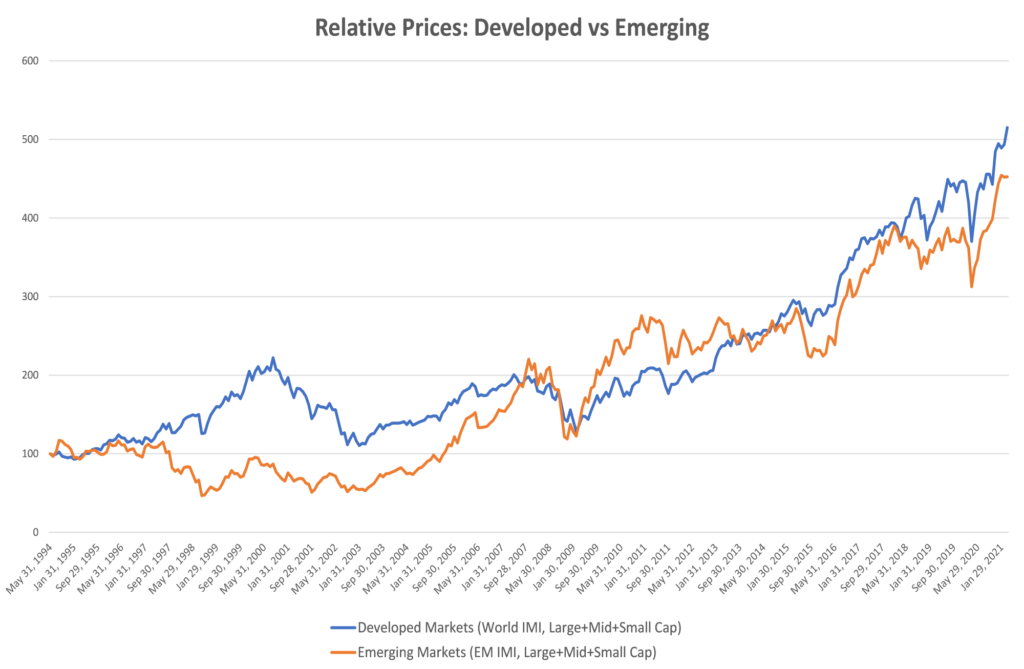
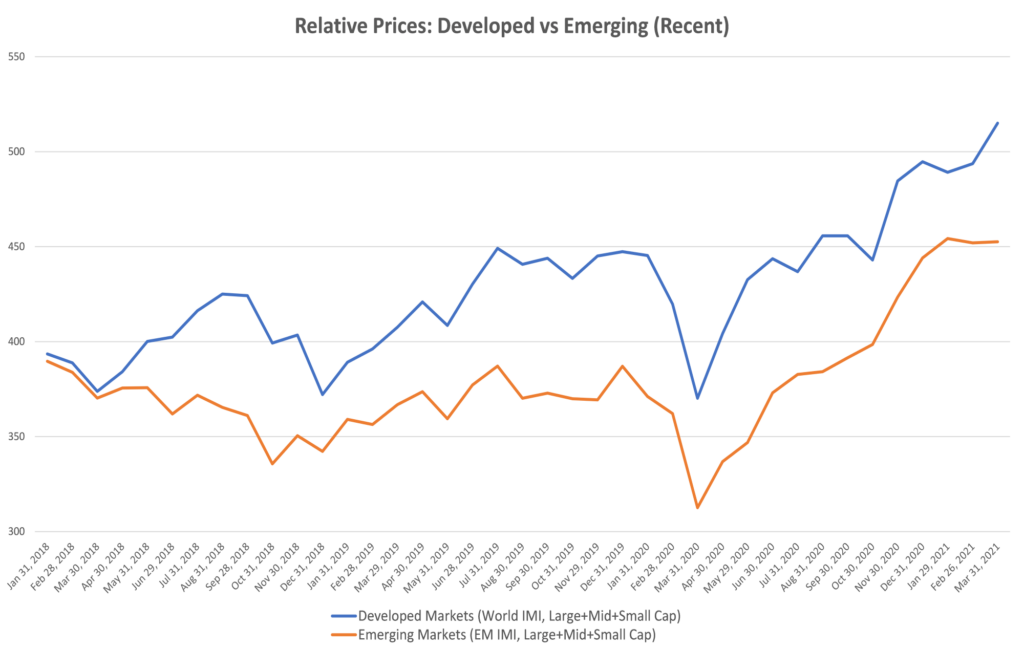
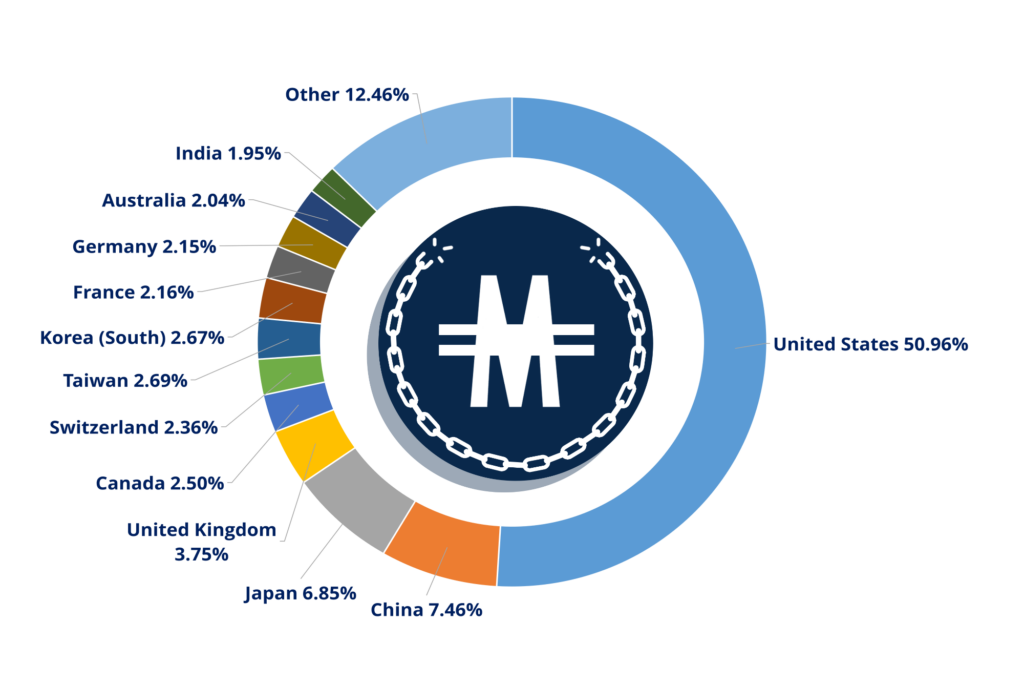
It contains a developed world ETF, a developed world small cap ETF, an emerging market ETF, some gold and silver, and on top we would also hold some cash.

  • Invesco MSCI World ETF (MXWS)
  • iShares MSCI World Small Cap ETF (WLDS)
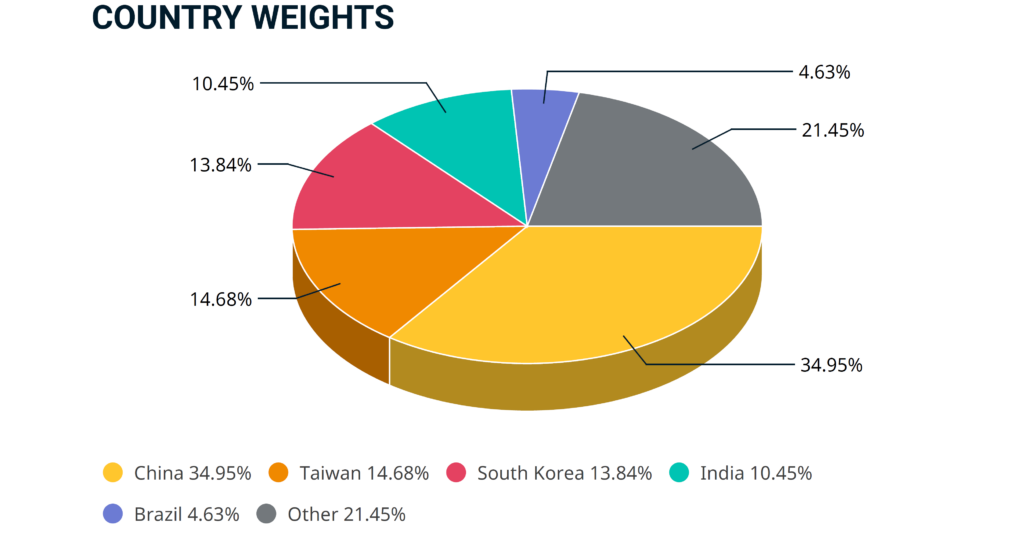
  • iShares Core MSCI Emerging Markets IMI ETF (EMIM)
  • iShares Physical Gold ETC (SGLN)
  • iShares Physical Silver ETC (SSLN)

We have a dedicated video and article covering this portfolio in more detail, found here for those interested.

A second portfolio we like is what we’re calling the Money Unshackled Vanguard Portfolio. This one’s based on two Vanguard ETFs covering the developed world and the emerging markets. This ETF combo works out cheaper than the popular single Vanguard All-world ETF and gives you some control over allocation between geographies.

If you like gold and silver, you could easily tack on those as well but there are no Vanguard ETFs for these. We suggest the iShares gold and silver ETFs.

  • Vanguard FTSE Developed World ETF (VHVG)
  • Vanguard FTSE Emerging Markets ETF (VFEG)
  • iShares Physical Gold ETC (SGLN)
  • iShares Physical Silver ETC (SSLN)

In addition to any ETF-based investment portfolios like the ones mentioned we also like to invest in P2P lending for the fixed income it provides, and Ben likes property for growth and regular cash flow.

What vehicles are you using to save for retirement and why? Join the conversation in the comments below.

Written by Andy


Featured image credit: Khakimullin Aleksandr/Shutterstock.com

Also check out the MoneyUnshackled YouTube channel, with new videos released every Wednesday and Saturday:

Are You Spending Too Much? What The Average Household Spends In The UK

Do you ever think you might be spending too much? We usually cover ways to boost your income and make money on this channel, but today we’re focusing on spending, and how your spending habits compare to the rest of the UK.

I’ve been thinking a lot about spending goals recently. Depending on your life goals, making sensible cuts can drastically change your quality of life for the better.

Saving an extra £500 a month might knock 15 years off an average person’s working life, according to our Retirement Calculator.

If you’re keen on clawing back some years of life, then it helps to compare your spending level to others’.

But maybe you’re happy with your level of spending and just want a nosey into your fellow countrymen’s finances. We’ve got you covered for that too!

Commission-free trading platform Stake are giving away a free US stock worth up to $100 to everyone who signs up via the link on the Money Unshackled Offers page, so be sure to check that out!

Alternatively Watch The YouTube Video > > >

The Data

The data in this video comes from the ONS, and covers the cost to households over the period April 2019 to March 2020 – i.e., the most recent period before the pandemic started messing with peoples’ lives.

These figures are therefore a representation of spending during normal times, which hopefully we’ll be heading back to soon! Famous last words…?

Average Monthly Household Spending

The average UK household spends £2,548 each month from their disposable income, which the ONS considers to be their take home pay. This is income after payroll taxes, student loan and pension contributions have been deducted. Spending does not include amounts saved or invested.

Here’s the breakdown by headline category:

By far the biggest expense at £849 a month is Housing, which includes rent and mortgage interest.

It doesn’t include mortgage capital repayments, as these are considered as investments in an asset and not a real expense, though if we were to include them, this figure would go up £122 to £971 a month.

Nor does it include so called “value added” home expenditure, such as extensions and new bathrooms and kitchens.

As it stands, housing is a third of the average household’s outgoings.

The next most significant chunk of money to hemorrhage out of your bank account each month is likely to be Food and other perishables – if we add eating-out into the mix, this makes up 27% of average outgoings, or £689 a month.

The next biggest cost is Cars and Transport, at £354 a month. Unlike houses, the ONS includes the cost of actually buying the car, as well as running costs – quite right too as cars depreciate to zero within a couple of decades while houses do not.

Also considered in here are non-car transport costs for those who take public transport.

Next up are gadgets, subscriptions, sports and other recreation which come to almost £300 a month. Then a monthly equivalent of annual holiday spend at £272 a month. And finally, £87 of miscellaneous.

Let’s now look at these figures by age, to make it more relevant to you:

There’s quite a difference in spend as people age, with costs falling across the board the older you are.

Older people are more likely to have paid off the mortgage, become a 1-car household, and tend to have less spare cash to fritter on gadgets, restaurants and holidays.

If we look at this same data in a table instead, we can easily see that a 30- to 49-year-old is at the most expensive stage of their lives according to the stats, with spending on everything except housing up massively from their under 30s counterparts – lifestyle inflation in action! As they earn more, people tend to spend more too.

Annual Household Spending

Let’s now look at the same numbers but annualized. This allows us to demonstrate a psychological blind spot that we have long suspected was at play in reported savings figures, but can now confirm.

In a previous article, “What Percent Of Your Income Should You Invest For Financial Freedom”, we talked about how much the average person reports that they save, and the average for someone aged 30-49 was just under £3,000 a year.

Looking at the same data as above but annualized, this age group is spending about £34,700 a year. In the middle of this age range, the average household disposable income for 35- to 45-year-olds is just shy of £38,000, making for annual real household savings of about £3,300 a year. The average household contains 1.8 adults, so that’s £1,800 per person.

That’s 40% less than what people report they save! Which means they’re in fact spending a good chunk of what they consider to be savings.

Their mistake is that they are including their “delayed spendings” in their savings figures, probably without even realizing.

To us, this shows that people do not understand the difference between savings and delayed spendings, and that the average person is spending way more than they think they are.

Cutting Back – The Easy Wins

If you’re spending more than the average household at your age and want to do something to address that, you might be tempted to go for the low hanging fruit: subscriptions, holiday budget, coffees, day trips out and so on.

But as we’ve seen, these are unlikely to be a significant part of your total spend. And, your Netflix subscription and holiday plans are probably the things that help you get through the working week with your sanity intact.

Instead, to make the biggest impact on your monthly spending you might want to make just 3 simple changes.

The Big 3 Life Expenses

Looking back at the first chart, there are 3 obvious categories that arguably have the least impact on your overall daily happiness, and yet cost the most money: Housing, Food, and Cars. If you want to reduce your spending, these are the main areas to focus on.

Major Life Expense #1 – Housing

Housing is likely to be your biggest expense, and here’s the averages broken down by subcategory and age group:

For a 30-49 year old household it comes to over £1,000 a month.

If you’re thinking that this figure looks low at £550, remember that it doesn’t include mortgage capital repayments. Also, if your household is closer to 30 than 50 then your mortgage costs might be more like £700, as the people who’ve paid off their mortgages by 50 start dropping out of the dataset.

This average gas and electric bill is interesting – it shoots up for the over 30s, suggesting the presence of kids. My gas bill certainly took a beating once I had to run a full bath every night to clean spaghetti sauce out of my little girl’s hair.

And then when the kids leave home and people get older and retire, and so are in the house more often, we guess that they run the heating more.

The cost of housing is not uniform though across the UK, as you may expect, and there are savings to found by upping sticks and moving somewhere less expensive.

While the UK average is £849 a month, the cost of housing is massively higher in London, the South East, and the East of England.

Every other region of the UK is below the national average, but if you’re looking for a saving of at least £100 above the average you could look to relocate to Yorkshire, Scotland, the North East or Northern Ireland.

You might also choose to downsize to spend less. This image from Netflix documentary The Minimalists shows a heatmap of typical home use:

If you find yourself in a 4- or 5-bed house, ask yourself how much of that space you actually use. The cost savings on your housing spend from downsizing could be hundreds a month.

We all take it for granted that we should be able to afford a big 4-bed house in our 30s, but why is that? Is it worth buying a big castle, if you find yourself chained to a desk every day trying to pay it off?

One way to course-correct from having already bought a big house is househacking, or using your house to make money to offset those large housing costs.

This could take the form of renting out one or more bedrooms to lodgers, or it could be by extracting some of the equity you’ve built up in the property to use to invest in other properties or the stock market.

I myself have done both, previously renting out a room in my 4-bed house to a lodger for 18 months, and taking tens of thousands in equity out to buy rental properties with.

Major Life Expense #2 – Food

The next biggest cost area is Food and other basics, which includes all food and drink, clothing, footwear, hygiene products like toothpaste and shampoo, and tobacco:

It’s the Food and drinks part of this segment that should get your attention. The average 30-49 year old household spends £509 a month on food and non-alcoholic drinks, with 40% of this cost being from eating out.

How does your monthly restaurant and café bill compare with the average household? Is it an area you can cut back on without sacrificing happiness? Would swapping a Five Guys takeaway for a McDonalds make you significantly less happy?

If your goal is financial freedom like ours is, it’s worth noting that saving even an extra £100 a month could shave years off your working life – so it might not even be right to think of it as a sacrifice.

Maybe you could think of it as trading a night out now for a few extra weeks of financial freedom in the future?

Major Life Expense #3 – Cars and Transport

This one really is an easy win, if you’re used to buying new cars or taking out lease cars on a monthly payment, which is essentially the same thing in terms of money wasted.

According to the AA, the average new car will have lost 60% of its value after the first 3 years – 8% being lost in the first mile, according to edmunds.com.

Is a 3-year-old second-hand car materially worse than a new car? Not really, especially when it’s been cleaned, valeted and serviced prior to purchase.

A good car that’s well maintained can last 15 or 20 years, so why would you buy a new one every couple of years? Let some other sucker take the hit from depreciation, and buy second hand.

You might also consider the quantity of vehicles that you own. As I now work from home churning out blog posts and videos, my household no longer needs 2 cars. Moving to a 1 car household would save us £200-£300 a month, as we wouldn’t need to maintain, tax, insure or replace a second vehicle.

Thousands of households, possibly including your own, have moved to a ‘Working From Home’ situation during the pandemic, with many companies now coming out to say they won’t expect employees to come back into the office for more than a couple of days a week.

Are you splashing money up the wall each month by having 2 big lumps of metal sat idling outside your door for the majority of the week?

Missing Out On Compounding

As we’ve said throughout this video, our goals are early retirement and financial freedom. The route there involves increasing our incomes, but also decreasing our outgoings where we can.

Where we make savings, it’s always with happiness in mind – there’s no point being miserable just to save money.

If you have a similar goal in mind and worry that you are spending too much, then be reassured that any steps you do take to reduce your spending will have a double benefit.

First, any spending cuts you make can compound as extra additions to your investments over the years to bring your retirement date closer.

And second, any spending cuts that you can make and maintain into retirement will mean you need less money in your ISA and pension accounts in order to retire, because you’d need less investment income in retirement to cover your now lower outgoings.

These early retirement topics are covered more in these two articles (FIRE1 & FIRE2), so check them out if you haven’t already.

Finally, remember that savings cuts can only go so far. Sometimes it’s more realistic to make additional income. Check out this article next, for 3 awesome ways to make a few hundred extra quid each month and reach your financial freedom goals faster.

What’s your biggest downfall when it comes to your outgoings? Join the conversation in the comments below!

Written by Ben


Featured image credit: Art Stocker/Shutterstock.com

Also check out the MoneyUnshackled YouTube channel, with new videos released every Wednesday and Saturday:

The FCA Says You Have No Idea How To Invest – Restrictions Incoming?

Recently the FCA published a report into the behaviours of investors. The conclusion was that newer investors are at risk of causing themselves harm. There has been an enormous shift in the demographic of investors in recent years and significant changes to what they invest in.

Newer investors have been found to be drawn more towards high-risk investing, have less investing knowledge, or disregard the risks, and many appear not to be able to withstand significant losses.

This research by the FCA – highlighting the downsides of democratising investing – could lead to future restrictions. Should investors who may have zero knowledge be allowed to participate in something where there is serious financial risk? After all, you can’t just jump out of a plane without a skydiving instructor.

In this post we’re going to share with you the key findings of the FCA report.

If you’re new here, or even if you’re not – check out the cash bonuses and free stocks offers on the Offers Page.

Alternatively Watch The YouTube Video > > >

Who Are The FCA And What’s The Report About?

The report which we’re looking at today has been carried out by a market research agency on behalf of the FCA. The aim was to conduct an in-depth exploration of self-directed investors’ behaviours, attitudes and financial resilience.

A self-directed investor means anyone who is making their own investment decisions such as making their own trades without the help of a financial advisor.

Before we get in the findings of the report, let’s quickly take a look at who the FCA are for those who don’t know.

In their words, the FCA aim to make markets work well – for individuals, for business, large and small, and for the economy as a whole. They regulate thousands of businesses, and their objective is to protect consumers, protect financial markets, and promote competition.

Overall, we think the FCA do a fantastic job. They’re the reason we feel comfortable investing our hard-earned money with a variety of investment platforms. The platforms must abide by the rules laid out by the FCA – segregation of client assets being one example.

According to the report, there is evidence that some consumers are making or are led into making poor investment choices. In some instances, people are missing out on returns, and in other cases they are being led to invest in high-risk products.

The overall theme of the report is that new investors are taking excessive risk, which they may not be able to afford, potentially prompted in part by the accessibility offered by new investment apps. Let’s now take a look at the key findings.

Gamblers and Thinkers

The report categorised investors into 3 broad groups – ‘Having a Go’, ‘Thinking it Through’, and ‘The Gambler’.

They do go on to break those groups down further into sub-groups, which you can check out for yourself if you’re interested.

The ‘Having a Go’ group are newer or less experienced investors. They often look for shortcuts, which can include ‘hyped’ options that they’ve heard about, or consider well-known brands as safe investments such as tech companies.

The ‘Thinking it Through’ group are more experienced and may have a professional or academic background in maths, finance, economics or business. They feel they have high levels of knowledge and are very confident in their abilities.

And finally, ‘The Gambler’. This group see investing as similar to betting. They are attracted to short-term high-risk investments like FX and CFD’s.

It sounds like they’re referring to the crazy lot over at WallStreetBets who are pumping certain stocks and crypto and are going to the “moon.”

High Confidence Is Misplaced

Regardless of group, investors, particularly those who invest in high-risk investments, tend to have a high degree of confidence. However, their behaviours and beliefs indicate that this can be misplaced – basically if we read between the lines, most of them taking on excessive risk have no idea what they’re doing.

They have a total lack of awareness of the risk – 45% don’t see ‘losing some money’ as a potential risk. That’s crazy. We understand this to mean 45% of say bitcoin investors or GameStop investors don’t think they can lose any money. Maybe we need a proper crash to knock some reality into them.

Moreover, gut instinct is apparently hugely important in decision making across groups. This is not surprising. After all, real research is hard work and it’s human nature to look for shortcuts.

Investing Is Now More Diverse

The report says that a more diverse audience appears to be getting involved in self-directed investing, potentially promoted by the accessibility offered by new investment apps.

It seems that investing before was predominantly white, older men, in professional occupations. But now there is a clear trend towards younger, more gender balanced, more BAME, and lower skilled workers taking up investing.

This chart shows how investors based on length of time investing has transitioned from mostly men at 67% to now slightly more women.

This chart shows that investing was previously a white person’s game but has clearly become more even amongst newer investors, which is great to see. The UKs white population is 87%, so if anything, 77% of new investors being white is actually underrepresenting that demographic.

This chart is looking at investing across the social grades. As you can see the dark green bars, representing high level professional jobs, has decreased proportionally among new investors. There has been a big proportional increase in more junior workers, and skilled manual workers investing.

That’s the way it should be. New investment apps and the internet are largely to thank for this.

New Investment Apps Are Taking Over

Newer investors are drawn more towards new investment apps, that are commission-free and very heavily advertised online and on TV. Talking of commission free apps how about a shameless plug?

Freetrade are giving new customers a free stock worth up to £200 when you sign up and deposit at least £1 when you use our link. This offer and others like it can be found on the MU Offers Page.

Back to the report, 51% of those who have been investing themselves for less than three years, use, or were considering using, a newer platform, versus just 39% of those investing for more than three years. We think this is obvious. New customers are always more likely to research the cheapest product, whereas existing customers may be more reluctant of going through the upheaval of moving platforms.

When new platforms are innovating more and simultaneously slashing costs, of course they will attract more customers than the so-called heritage platforms. The report says that the rise of new investment apps, such as Trading 212, FreeTrade and Crowdcube, have significantly reduced the barriers to entry.

Likewise, apps like Moneybox, which round up spending and invests the ‘change’ offer an easy, passive and low effort route into investing. Apps like these are great, but kind of backup the FCA’s grumble about investing being open to anyone, regardless of their knowledge or capacity for risk.

This quote particularly stood out to us, “I started looking at investment websites like Vanguard, but I felt completely out of my depth, almost like I didn’t belong there. Apps like Trading 212 are really easy to use – the accessibility really catered to me and they even have demo accounts to try it out first.”

In our opinion Vanguard is probably the easiest investing website to use and potentially the safest, considering it only offers a few solid low-cost index trackers. If you can’t get to grips with Vanguard, then we have no idea how they understand Trading 212 with the complex instruments such as CFDs that it offers and much wider investment range.

A simple user interface doesn’t make the available investments any easier to understand.

Investors Now Get Information Online

There has been a major shift to online sources of information. Investors now have direct access to the opinions of trusted experts at their fingertips such as Warren Buffet, Martin Lewis and Money Unshackled.

Okay, you caught us – they didn’t quite name us alongside the big boys but maybe one day.

While traditional sources of information are still very popular no matter the experience of the investor, new investors are overwhelmingly looking towards contemporary sources, which includes YouTube, Instagram, podcasts and so on. 63% of new investors use these contemporary sources of info compared to just 32% for those who have been investing for over 3 years.

YouTube looks to be the most popular source of contemporary information with 27% of new investors using it, followed by social media at 25%, and Influencers are not far behind at 19%.

We don’t know how Influencers differ from the first 2 but surveys always have weird stuff in.

One finding that stood out to us was the identification that investors often come across investment opportunities during the course of their day-to-day lives, rather than specifically researching them.

Algorithms, such as what you get on YouTube and other social media, can create a perception of ‘buzz’ around a topic. YouTube knows that WE like investing, so when something like GameStop was making headlines, our YouTube recommendations feeds were full of this nonsense. You’ve probably seen something similar on yours. Right now, it’s crazy hype about Crypto.

Noobs Taking On Increased Risk

The report says that new investors are jumping straight into high-risk investment types more quickly than those who have been investing for longer.

This chart shows that clearly. Here we have many of the so-called high-risk investments and the percentage of investors who currently invest in each. The green bars represent new investors, and the blue bars represent those who have been investing over 3 years. For almost all of the high-risk investment types, noobs are overwhelmingly involved in them.

No Emergency Fund

To top it all off, these risk takers have also been found to be more at risk from a financial hit. 59% claim that a significant loss would have a fundamental impact on their lifestyle, compared to 38% of those who have been investing for more than three years.

The risk-takers do not have a cash buffer to fall back on and are more likely to be under financial pressure in their day-to-lives. Some of those surveyed even talked about ‘dipping back into’ investments when short of cash as if they these investments were like a bank account.

Money Unshackled’s View

Most of the findings in the FCA report probably shouldn’t come as any surprise. We’ve all seen how popular commission-free investment platforms have become and we put this surge of popularity down to falling costs of investing and much better information.

In years gone by, it was near impossible for the ordinary person to invest, so it is likely that some demand was there, but it was just going unmet.

There was also a lack of information, which is now widely available for free such as right here on YouTube. This new information is of no lower quality than what so-called experts would give you. It’s been proven that “experts” on average underperform the market.

Financial advisors are mostly sharks – yes there might be some good ones out there, but how can you tell them apart from those who just want to take a slice of your money off the top to enrich themselves?

Further, it’s perhaps unusual for the FCA report to fail to mention low interest rates. We would have considered this to be a driving factor for ordinary people to start investing. Previously you could get 4-5% interest by just sticking your money in a safe savings account, so there was far less desire to invest. Today, there is no safe place to store money that gives a positive real return, so everybody has no choice but to invest.

Looking back at the high-risk investments chart again, we would like to know how they determine what a high risk, high return investment is. We’ve never considered ourselves to be excessive risktakers but notice they have included P2P Lending in the high-risk bucket.

We’ve been investing in P2P for years and certainly wouldn’t consider it high risk. Most P2P platforms take out collateral on loans and get director guarantees. Then you diversify across hundreds of loans, and possibly over multiple reputable P2P platforms. Plus, the FCA have rules that you shouldn’t invest more than 10% of your wealth in this asset class. That doesn’t seem overly risky at all.

We welcome guidelines and warnings, but we find restrictions like this a bit meddlesome as we’d personally rather have the choice, and there’s always the worry that they’ll go a step further and impose restrictions that stop normal people buying other assets like stocks.

They’ve also recently banned the sale of crypto-derivatives to retail consumers, which is why you won’t find any bitcoin ETFs in the UK.

On the back of this report, we expect that the FCA will eventually clamp down further on risky investments. How they do this is anyone’s guess, and we just have to hope that it won’t affect sensible level-headed investors.

Do you invest in any of the mentioned risky investments? If so, which ones and why? Join the conversation in the comments below.

Written by Andy


Featured image credit: Paulik/Shutterstock.com

Also check out the MoneyUnshackled YouTube channel, with new videos released every Wednesday and Saturday:

The Early Retirement Danger Zone | Hack The 4% Rule & Hold Onto Your Money Forever

Followers of the FIRE lifestyle will have heard of the 4% safe withdrawal rate and will be aiming to build an investment pot using this rule that’s large enough to provide them an income when they’ve retired.

The problem with the 4% rule is that it lulls us freedom fighters into the false sense of security that following a simple formula will guarantee us a set level of income in retirement.

But because your freedom fund contains a range of investments, the value of your pot will be volatile. What is worth £500,000 today could be worth £400,000 tomorrow. Or £600,000. You just don’t know.

The first 5 years of your FIRE retirement are what we call the Early Retirement Danger Zone. You have no state pension to fall back on because you’re too young, so you need your investments to perform.

But what if they don’t? What if there’s a market downturn? Using the S&P 500 Index as a measure, there have been 16 bear markets since 1926, averaging once every six years.

Today we’re going to tell you how to hack the 4% rule, force it to work for you, and make sure you can safely retire early while holding onto your money forever!

Special offer: New users to Genuine Impact will receive 1 month’s PREMIUM access for free when you sign up via this link. Genuine Impact is research and analysis app that provides insights for investors. Be sure to check them out!

Alternatively Watch The YouTube Video > > >

The 4% Rule And The Problem Of Retiring Early

As a brief recap, the 4% rule says you can withdraw 4% per year of the value of your retirement pot on retirement day, adjusted each year thereafter for inflation.

The origins of the 4% rule started with the famous Trinity study, which backtested the performance of retirement portfolios built from a range of different stock and bond mixes and withdrawal rates covering the period from 1925 to 1995.

The stock market studied was America’s S&P 500, and it was determined that portfolios built from 100% stocks or a 75/25 stocks to bonds split had around a 95% chance of surviving for 30 years.

The study was set up to provide answers for people retiring in their 60s, hence why a 30-year portfolio survival period was chosen.

Unfortunately, this implies that those retiring earlier are at risk of running out of money during their retirements.

With a 95% success rate, this means 5% of people should expect their freedom funds to run down to zero within 30 years of their FIRE date, based on the history.

Here’s a chart that shows the results of a 100% stocks portfolio with starting dates in each of the years from 1871 to 1989:

6 out of 119 tests resulted in going bust. But even if you DON’T run out of money after 30 years, you still might easily end up in the 24% of people whose portfolios’ values were down – people who wouldn’t be able to keep withdrawing enough to live on without eventually depleting their investment pot.

In almost all cases, the damage was done in the initial years, and whether a pot survived its owner or not came down to the events immediately following the retirement date.

Sequence Risk

The greatest risk to your portfolio comes in the first 5 years or so after retirement.

This is because if the stock market were to fall in those early years, it would likely reduce your pot to below the level at which you could safely continue to draw from it at the same rate. Even when the stock market recovery eventually comes, your pot may be too far gone to recover while also sustaining your withdrawals.

While for example, if your first stock market crash came a decade after retirement, you would have built up a 10-year buffer of growth that could happily be eaten up by a future bear market without your withdrawals being affected.

This risk is known as Sequence Risk, and it is the risk of the good times and the bad times happening in the wrong order, or the wrong “sequence”.

According to AJ Bell, the average time it takes for the stock market to recover based on the last 10 bear markets prior to covid was 648 days – nearly 2 years.

The shortest recovery in history was the covid crash, which lasted only 4 months.

While the longest was 1,529 days – just over 4 years – following the 2008 financial crisis.

If you can set a plan in place to protect yourself for the first 5 years of retirement without needing to eat into your pot, this would nip the sequence risk in the bud.

You’d be covered for repeats of the historic worst-case scenarios, plus a bit extra. Get past this opening phase of your retirement, and you should be into clear waters.

Your FIRE Number

First, you need to know your FIRE number. This is calculated as your required living expenses in retirement divided by 4%, if you are using the standard safe withdrawal rate.

You can calculate this easily and get more information including the years until you can retire by using our free FIRE Calculator.

Try playing with it to see the effect of tweaking the rate of return on your investments, or by cutting your expenses a little, or adopting a higher or lower withdrawal rate. The difference will likely shave years off your working life.

The FIRE number is the size that your savings and investments need to be before you can retire. The usual assumption amongst those seeking early retirement is that this number, once reached, is set in stone.

But what if the stock market falls the day after you reach your number and quit your job, and what was once a £1m pot is suddenly worth only £700,000?

You’ve stopped working to start living. Do you have to change your plans and forget about retirement? Stop living and start working?

Protecting Your Nest Egg

The 4% rule can be adapted to protect your financial freedom fund in those first years of retirement, in case the market goes south right after you’ve told your boss that they’re fired.

We just need to add on one or two extra rules into the mix.

Both of these rules are fairly common sense, but the first time we saw them named and singled out for discussion was in Kristy Shen’s book “Quit Like A Millionaire”, so due credit to her.

Rule #1 – The Cash Cushion

The very worst thing you can do in a stock market crash is sell. And yet, as a retiree living off your investments, you may have little choice but to do exactly this.

This is where the cash cushion comes in.

Say your FIRE number is £1,000,000 – the amount you’d need to retire, covering your outgoings of £40,000 a year at the 4% rule.

You need to be able to avoid selling investments for up to 5 years.

To cover your outgoings during this time, having a cash cushion of £200,000 would mean you could eat this up first without ever having to touch your investments.

£200,000 sounds like a lot of extra cash to have to build up. But hold up. A balanced portfolio might already include cash in the region of 10%, so you can splurge on opportunities, but also to cover you in scary situations exactly like this.

So, a £1,000,000 freedom fund might already contain £100,000 of cash, meaning you need to find just another £100,000 to cushion you in your early retirement years.

As a counterpoint, it’s worth noting that if you did save up an extra £100k before you retired, you could invest it instead, and it would reduce your required withdrawal rate from 4% to a safer 3.6%. But it’s not clear that this would be safe enough if you were making withdrawals during an initial market crash.

In any case, while you’re building your pot, it probably makes sense to keep that extra money invested in the stock market so it can grow, rather than being held as cash, and convert it into your cash cushion just before you retire.

Rule #2 – The Yield Shield

Still, having to increase a freedom fund by £100,000 seems like a lot of extra hardship. We can get this number down significantly if we build a yield shield.

The yield shield brings in dividend stocks to your portfolio to give you extra protection in the first 5 danger years, after which point you can switch back to your preferred allocations.

Stock market returns are a combination of capital growth plus dividends. Stocks which are likely to provide decent capital growth but little dividends are called growth stocks. Stocks which provide little capital growth but good dividends are called dividend stocks.

The theory is that dividend stocks can better hold their value during a downturn due to being stable, established companies, and in most cases should continue to provide a dividend to you regardless of what is going on with the share price.

Normally we prefer growth stocks, as their total returns tend to be better and they avoid all dividend taxes (including the nasty foreign dividend withholding tax). But during the early danger phase of your retirement, less volatile, cash flowing dividend stocks may help you to better hold onto your money.

The yield shield works by switching out your portfolio on retirement day to a portfolio that keeps a similar geographic mix to what you already have, but focusing on high-yielding dividend stocks.

After the first 5 years, you’d switch back.

In practise it could work like this. If you’re currently tracking a global stocks index with a fund like the Vanguard All-World ETF (VWRL), you could temporarily swap it out for the SPDR® S&P® Global Dividend Aristocrats ETF (GBDV).

This ETF tracks an index of top-quality dividend payers, with a weighted average yield of 4.85%, while the Vanguard All-World ETF typically yields around just 2%.

In the event of a downturn, you would in theory be ok as the 4.85% yield covers your 4% withdrawal rate, although in practise some of the companies would stop paying dividends.

This specific Dividend Aristrocrats fund though only admits companies with a 10-year track record of payouts, so you’d hope this effect would be minimal given bear markets happen more often than that, roughly every 6 years.

The yield shield means you don’t need nearly as big of a cash cushion – in theory, none at all, though we still think it’s sensible for diversification and risk reasons to hold 10% of your pot in cash regardless.

This is therefore a good alternative solution which allows you to retire on your FIRE date with your standard FIRE number and with peace of mind.

The 3% Rule

Much of the stress around retiring early could be resolved by adopting the 3% rule instead of the 4% rule.

A recent continuation study into the safe withdrawal rate extended the Trinity study period to 2017, and here’s the results:

The 4% rule for a 100% stocks portfolio still has around a 95% success rate after 30 years, now down slightly to 94%, and tails off over the decades.

But the success rate of a 3% withdrawal rate does not tail off – even after 40 years, it remains at 100%, meaning that EVERY portfolio tracking the S&P 500 since 1926 would have survived for at least 40 years.

But for us, we don’t want to be running to the safety blanket of the 3% rule.

This is because, using the MU Fire Calculator, a £1m required FIRE number becomes a £1.33m target by moving the withdrawal rate slider. And for this particular example, the years until FIRE move from 14 years at 4% to 18 years at 3%.

Could you be bothered to work an extra 4 years and build up an extra £333k if there was a smart alternative such as the cash cushion or yield shield, which meant you could retire today?

What’s your FIRE number and are you relying on the 4% rule? Check out the calculator, and join the conversation below!

Written by Ben


Featured image credit: Einstock/Shutterstock.com

Also check out the MoneyUnshackled YouTube channel, with new videos released every Wednesday and Saturday:

Emerging Markets: Buy, Buy, Buy!

2021 has not been kind to Emerging Markets investments. While the developed nations have powered ahead on a wave of optimism caused by the vaccine rollouts, the emerging markets first fell, then stagnated.

A low price relative to the developed world is a good thing for would-be investors in the emerging markets.

But even if the price were higher, we’d still be advocating getting your money into these growing parts of the world. Loads of investors don’t bother with the emerging markets, preferring home country and developed world bias, but we think that is a huge mistake.

We’re going to tell you what’s going on in the emerging markets, why now may be a historically opportune moment to start investing in them, and how to go about doing it. Let’s check it out!

Some great places to invest in the emerging markets include Freetrade (who’ll give you a free stock worth up to £200 for signing up using this link), and others which we’ve looked at on the Best Investment Platforms page. Check it out for platform reviews and welcome offers.

Alternatively Watch The YouTube Video > > >

What Are The Emerging Markets?

A country classified as an emerging market is a nation that has just some, but not all, of the characteristics of a developed market.

Typically, this involves a move towards greater democracy, greater regulation of the banking system, and a more professionalised stock market.

The economy and infrastructure of these countries will typically be a couple of decades or more behind those of developed nations, with people living within these countries gradually gaining more spending power, which brings with it a more industrial economy, better services and better investment in infrastructure.

But we shouldn’t just think of the Emerging Markets as one big generic blob. The MSCI Emerging Markets IMI Index is a grouping of 27 diverse countries that have little in common other than their growing economies and status as Emerging Markets, so should be considered individually.

Emerging Market Prices vs Developed

Let’s first look at some long-term market price trends. We’ve charted the MSCI IMI indexes for both the developed and emerging markets since index inception. IMI or Investable Market Index simply means that it includes Large, Mid and Small caps.

Starting in 1994, we can see 3 distinct time periods: the first covering 1994 to 2007, where the developed world took centre stage; then 2007 to 2014 when the Emerging Markets powered ahead; and finally, 2014 to the present day, when the story has been all about developed countries like America steamrollering all in their path.

Asset prices can go through long cycles of being up or down relative to each other, based on what’s hot at the time. Today’s fashion is for US stocks, benefiting Developed Markets indexes, with the US valued highly as a safe haven in turbulent times. 

We see the relative discount in the emerging markets more clearly if we zoom in on the last few years.

To right of the chart is now, with the vaccine effect, with the developed countries storming ahead and the emerging markets suffering a likely temporary price stagnation.

How We Invest In The Emerging Markets

The Emerging Markets is covered by one of the 3 equity funds in the Money Unshackled Ultimate Portfolio, discussed in more detail here.

The fund we each use is the iShares Core MSCI EM IMI ETF (EMIM), which faithfully tracks the MSCI Emerging Markets IMI Index of Large, Mid and Small Cap companies.

Index investing like this is one of the best way to invest in the Emerging Markets, partly because index investing just kicks ass in general for its low fees and access to entire markets, but also because accessing foreign stock markets directly can be tricky – especially emerging ones.

Many UK based investment platforms don’t even have the option of buying stocks on exchanges outside of Europe and North America.

So for us, it’s the MSCI index all the way.

The Big 4 Emerging Markets

If we look at the split of the MSCI Emerging Markets IMI index by country, it might surprise you to learn that 74% of this index is just 4 countries – China, Taiwan, South Korea, and India.

We could analyse the history of stock market price movements all we want, but the decision to invest in the index should essentially boil down to this question: do you think these 4 countries and their companies are going to do well over the next 10, 20 or even 30 years?

Each of these 4 countries is of such a considerable size in the index that poor performance in any one could significantly drag down overall index returns. Let’s now look at each of these developing superstars, in order of size.

#1 – China (35% Of The Index)

China is the big boy of the index and deserves the most focus – but even at its current weighting of 35% it is understated.

China has several different classes of shares, one of which – A Shares – can only be bought by Chinese citizens and certain approved institutional foreign investors.

As such, index providers like MSCI choose not to include them in full. Here’s where the index stood as of 2019, with it having grown the China holdings since 2018:

Source: KraneShares

You can see the planned future inclusion of A Shares, which means that sometime in the future MSCI’s intention is to make China be around 50% of the index. So hopefully, China continues to perform well in the future.

There are many good reasons to think that this will be the case. Since setting covid loose on the rest of the world, after those first few weeks of panic in early 2020 China’s economy was able to carry on like nothing had happened.

While the UK and Europe were huddled indoors, cases in business-as-usual China during the January 2021 peak were around just 100 a day, in a country of 1.4bn people.

China isn’t even really bothering to vaccinate at speed either, with only 14 people in 100 being offered a jab so far, despite China being one of the few countries to have developed a vaccine.

But this doesn’t seem to have hindered them, nor stopped them growing – they are instead selling their vaccine to other countries, and using it to grow their political influence in those places.

In April 2021, the IMF forecasted China’s GDP would grow by 8.4% this year. While developed Europe grinds to a halt, China’s economy is cracking on with making money, which bodes well for the stock market.

Longer term, China is widely expected to catch up to the US in terms of geo-political power and wealth by the 2030s – so much so that worries about China dominate US politics.

If you remember, it’s all Trump ever banged on about.

America sees China as their economic rival, which is as good a reason as any to assume that China will do well over the years to come. China is also home to some of the biggest companies in the world, including social app giant Tencent who own WeChat and QQ, and online retailers Alibaba and JD.com – all massively popular in China and massive by market cap.

There are strong arguments that China should be stripped from the Emerging Markets and given its own category, due to its size.

Indeed, some ETFs now exist which exclude China from the Emerging Markets, such as the Lyxor MSCI Emerging Markets Ex China ETF (EMXC).

For more information about investing in China, check out our dedicated China article next.

#2 – Taiwan (15% Of The Index)

38% of the Taiwan slice is one company, Taiwan Semiconductor, one of the most important technology companies in the world! It supplies a significant chunk of the world’s semiconductors, critical components that power most modern electronics including computers, smartphones and cars.

54% of the entire world market in fact comes from this one company. It’s no small exageration when we say that the world as we know it would not exist without Taiwan’s semiconductor industry.

If it’s not in your portfolio, it needs to be!

There has long been a political risk with investing in Taiwan that its neighbour, China, might decide it wants to flex its muscles and forcibly make Taiwan part of mainland China.

It’s an active political issue we need to be aware of as investors watching from afar, and price this risk into how much of your pot you choose to allocate to the emerging markets.

With the emerging market nations, increased risk of disruption due to political upheaval is part of the territory.

Though there would doubtlessly be some initial market panic and noise, the long-term economic impact is unknowable.

#3 – South Korea (14% Of The Index)

South Korea are a trading nation on the rise who sit between the Developing and Emerging nations, with its 2 biggest trading partners being China and the US.

As a technology exporter, when other nations do well, so will South Korea. Their most significant company is Samsung, making up 32% of the value of the South Korean part of the index.

In some developed market indexes including the FTSE Developed World Index, South Korea is even considered to be a developed country.

Along with the arguments for removing China from the Emerging Markets, this shows how the lines can be blurred when trying to shoehorn diverse countries into 1 of just 3 categories (the third being Frontier Markets).

#4 – India (10% Of The Index)

A lot of the reason behind the fall in the Emerging Markets index in 2021 is reflected in what’s going on in India right now. India is struggling to combat covid, much like Brazil, Chile, and other smaller emerging economies.

India has only vaccinated 9% of their population, but unlike China they are fast losing control of a new spike in cases that has spooked markets.

Much of these covid stats are just short-term noise though, in our opinion, that won’t impact stock prices long-term.

Even in the short-term they should bounce back, with ratings firm Care Ratings forecasting India’s GDP will grow by 10.2% over the next year, which should spill over into stock market prices.

The current fall in the price of Emerging Markets ETFs is a good thing, as you can now buy more, and we can be confident that prices will rise and even catch back up with the developed markets in due course.

India has a lot going for it demographically in the long-term, including a population of 1.4bn people who are on the long, slow march away from poverty towards middle-class affluence.

This is an enormous workforce ready to take advantage of an expected move towards offshore digital outsourcing of jobs from the UK and US.

India also has the world’s largest youth population, with a quarter of Indians aged between 10 and 24 – i.e., the wealth creators of the future.

Appropriate Portfolio Allocation

If you’ve decided to invest in the Emerging Markets, you next need to decide by how much.

To get a similar breakdown to that found in the Vanguard FTSE All-World ETF (VWRL) – an index-investor-favourite which covers the whole world – you might allocate 13% to the Emerging Markets.

But we instead like to weight our equity allocations with 18% to the Emerging Markets. This overweighting increases the China allocation from 4.9% to 6.7%, Taiwan and South Korea from 1.7% each to 2.4% each, and India from 1.3% to 1.8%.

That’s a 40% boost in allocation for the Emerging Market countries. One reason to be bullish about the Emerging Markets is the relative discount versus the Developed world, as we discussed earlier, but our main reason for overweighting is that we think these countries are better placed for growth over the long-term.

We’ll be keeping a close eye on the Emerging Markets over the years, and if they continue to grow relative to the Developed world we may have to increase our allocations in them.

Do you invest in the emerging markets, and what’s your allocation? And if you don’t invest in them, why not? Join the conversation in the comments below!

Written by Ben


Featured image credit: Ascannio/Shutterstock.com

Also check out the MoneyUnshackled YouTube channel, with new videos released every Wednesday and Saturday:

Getting to 200 Grand – What I’d Change About My £200k Portfolio

When you reach an investment milestone like £200k, it’s good to reflect on your achievements so far, but more important is to course-correct before your past mistakes become any more ingrained.

Normally, for investors who only invest via online investment platforms or from an app on their phone, fixing a portfolio can be as simple as clicking the sell and the buy buttons in the right order.

But if you hold illiquid assets this isn’t as easily done. You might even have the first-world problem of holding assets which have such high returns that you can’t justify selling them, even though your strategy has changed since you bought them.

In this post, I want to share with you the details of my Financial Freedom Fund, so you can get a feel of how someone might come to accumulate £200,000 in just 5 years starting from almost nothing, and also to arm you with my experience so you can replicate this milestone while avoiding my mistakes. Let’s check it out!

I first started investing in stocks and ETFs on Freetrade, and it is still one of the best places to invest and grow a wicked portfolio.

As the name suggests, Freetrade doesn’t charge any trading fees, making it perfect to experiment with different combinations of funds and stocks without feeling trapped by fees.

Also, Freetrade are giving away a free stock worth up to £200 to every new customer who opens an account with them and funds it with at least £1. The offer is only available when you use this link.

Alternatively Watch The YouTube Video > > >

My £200k Portfolio

Let’s quickly look at the detail of this portfolio. Here’s the financial freedom part of my net worth, broken down. What should be glaringly obvious is that most of it is invested in Buy-To-Let property, specifically high cash-flowing terraced houses owned with mortgages, which were my first serious investments since committing to early retirement:

It’s this section of the portfolio that has seen the most capital growth, up by over 30% in the last year alone, and over 50% in total. It currently makes up 2/3rds of the pot.

I’ve consolidated most of my stocks and ETFs into a single Stocks & Shares ISA.

My old workplace pensions are likewise consolidated into a single SIPP. I might have regretted how small this slice is relative to other people in their early 30s… if not for the fact that I was purposefully diverting every penny I could from my wage into buying properties, which I saw as being of greater value.

There is also some small allocation to Peer-To-Peer Lending investments, and some commodities. And as we say at Money Unshackled, every portfolio needs a bit of cash.

There’s a red stain on the portfolio in that I partly financed the properties with 0% interest credit card debt.

Getting to £200k – Investing In Order Of Return

The original plan with this Freedom Fund was to invest my money in order of whatever assets could provide the greatest returns. I would worry about diversification later.

The answer for me lay in leveraged rental property.

My rentals give out pre-tax rental returns in the region of 11%, which is a higher return than the stock market, especially once leveraged annual capital gains of around 12% are added on as well.

My gamble of investing early on for maximum return rather than diversification has paid off so far – it provides a high second income AND incredible capital growth, and it has pushed the portfolio up to £200k in about 5 years. But it is now time to worry about diversifying.

Course Correction – Investing To Diversify

I got to £200k by leaning heavily on property, but I now need to focus on diversification. For the last year I have been ploughing all my investable money into the stock market, rather than hoarding it in cash ready for the next property.

A well-rounded portfolio should invest across multiple asset classes, but also many positions within each asset class.

As it stood, apart from some small-change, this portfolio held 4 assets – all being rental properties, and all serving the same demographic in similar locations to one another. It was NOT diversified.

Owning multiple rental properties offers some protection in case one tenant stops paying rent, but to be truly diversified you need to own the world – and that means owning stocks.

My small but growing equity portfolio contains 9,000 stocks, achieved by owning just 3 equity funds in my ISA and 2 in my SIPP, plus a smattering of individual stocks. There are also holdings in gold and silver.

The plan is for the allocations in the Stocks & Shares ISA and SIPP to grow over the years by drip feeding income into them monthly, until they catch up to the property slice.

Risk

If we look back at the portfolio, the portion invested in equities is what we would consider to be relatively safe and secure, due to good diversification and liquidity. The part representing just 4 individual properties is at far greater risk.

If I had desperately needed cash during 2020, I may have struggled to sell a property to save my bacon. But if I’d owned more shares, I’d have been fine – though they may have dropped in value.

Likewise, in a downturn I could easily lose all 4 of my properties’ incomes if tenants could not pay rent, while the odds of all 9,000 of my stocks failing to perform would be very low indeed.

The risk in my portfolio is therefore much higher than someone who owned purely equities or a mix of equities and bonds, which is probably most investors. But are the returns on this portfolio proportionally high too?

Return On Investment

Here’s the expected future weighted average returns on this portfolio:

For property, the return is a mix of 8% after-tax rental profits that I’ve been achieving consistently, plus 12% expected capital growth on the equity.

A very brief explanation for why these 2 numbers are so high is because I’m leveraging my equity using a mortgage, so the returns get amplified because I only need to invest about a quarter of the house’s value. 

After inflation that’s a 17% real return. The equities are expected to perform at historical market averages, while P2P and cash are assumed to continue at current levels of performance.

The weighted average real return of the portfolio overall is expected to be 12.8%.

This compares very favourably to a portfolio built using unleveraged assets such as stocks, and provided I continue to be fortunate and not succumb to the risks that low diversification brings, this asset mix should power me towards my Financial Freedom target at a fast pace.

The properties I already own should multiply on their own as well over the years, as I can extract equity from the growth to buy more properties with, which will lower the risk while increasing the returns.

If you take away one thing from this review, let it be that you too should consider getting some rental property in your own portfolio early on, for the boost to returns that it brings.

Effort

That said, why would anyone want to decrease their portfolio average return by diversifying away from property towards stocks? Part of the reason of course is risk. But also, you have to consider the effort involved.

£200k is a good start but it needs to grow to around £900,000 to give me and my family the lifestyle we’d want in early retirement.

This is my household’s FIRE number – FIRE standing for Financial Independence, Retire Early.

To find out how big your pot needs to be to retire early, check out the Money Unshackled FIRE calculator. You can tweak the returns based on your own portfolio’s asset mix, and it will tell you when you can retire and what your FIRE number is.

You might be happy to put more effort into managing your investments upfront, if they give you a head start on your FIRE journey. It might just shave some years off your goal. But if you have other commitments, understandably you may not want the hassle long-term.

Right now, big percentage returns are important to me because I need all the help I can get to grow my pot fast. But once the pot is built, I could tolerate a lower percentage return in exchange for a higher return in pounds, by virtue of the pot being a lot bigger.

Owning rental property is many times more effort-intensive than investing in ETFs. Even with the use of property management agents, there’s still a fair bit of ongoing admin to do.

This all runs contrary to my desire to sit in a hammock staring into space from no later than the age of 40 onwards.

The Stocks Allocation

A portfolio based mostly around passive equity-based ETFs can be automated. If we dig into the equity section of this portfolio, this is predominantly made up of the Money Unshackled Ultimate Portfolio, covered in detail here.

The MU Ultimate Portfolio: Geographies

Above is the split of the equities in the ISA by geography, and the portfolio covers the top 99% of market capitalisation in those countries. When this £200k portfolio grows into a £900k portfolio, the intention is that this component will be the largest chunk.

Money gets drip-fed into this section of the portfolio regularly and is automatically allocated into the pre-planned allocation of global funds. When I reach my FIRE date, I will simply drip-feed money OUT of it regularly instead.

That’s as complicated as investing needs to be.

The equity investments in the SIPP follow a similar idea of owning a diversified cross-section of the world, but with a slightly different set of funds.

A good strategy is to draw an increased income from the rest of your portfolio first when you FIRE, such as your ISA and properties, and access your SIPPs and other pensions from when you’re allowed to, which currently for our generation will likely be at 58.

Be sure to check out this article which shows you how to draw up a retirement income plan using a combination of ISAs and Pensions.

The Portfolio I’m Aiming For

Seeing as I have already done the hard work of establishing a property portfolio, I’m happy to hold on to them for their high returns, and even add to them over time – I’d be happy at around 30% of the total pot:

My main task between now and my early retirement date is to plough money into the stock market, bulking up my ISAs and SIPPs to reflect the green and yellow portions of this pie. You can see the specific weightings of the top countries for the equities, with the US making up 25% of the pot, or half the equity.

Above is another way to look at the target equity split, showing off the small cap and emerging markets elements. With a full 20% invested in the emerging markets and small cap stocks, this is hardly a low-risk portfolio. But it will have a good balance of diversification, liquidity, and returns.

The expected real rate of return shifts from the current 12.8% to 7.5%, still far higher than a stocks-only portfolio which might average 5% after inflation.

Actual vs Target Splits

Portfolio Financing

If you too like the idea of starting out with a higher risk strategy of targeting the highest rates of return first, it might help you to know that the way I got started with rental property was to optimise the use of good debt.

My first 2 rentals were paid for in part with money I had borrowed on 0% interest Money Transfer Credit Cards, but even MORE so by remortgaging my own home and extracting equity from it.

Much of this goes against the grain of what you are told you aren’t supposed to do, and this definitely shouldn’t be considered advice. But to get ahead in life, it’s worked for me to ignore the mainstream guidance.

What do you need to change in your portfolio, or are you happy with it as it is? Join the conversation in the comments below!

Written by Ben


Featured image credit: Vitalii Vodolazskyi/Shutterstock.com

Also check out the MoneyUnshackled YouTube channel, with new videos released every Wednesday and Saturday:

What We Discovered When We Analysed The S&P 500.

We all hear a lot of so-called facts that we just accept as gospel. Things like it takes seven years to digest chewing gum or that goldfish have three-second memories.

While these and other so-called facts don’t affect your life in any meaningful way, we also hear loads of “facts” about investing that could prove dangerous if we rely on them when building our portfolios but are then later proven to be incorrect.

There are hundreds of these so-called facts that we just accept because some faceless analyst or reporter says so. We personally like to verify as much as we can, but we’re often hamstrung by our lack of accessibility to good data. Detailed financial data seems to be only available to the billion-dollar financial institutions.

In this video we’re deep diving into the last 33 years of S&P 500 total return data to find out the real facts.

We’ll learn what the overall returns were, the impact of exchange rates, the frequency of corrections and crashes, the effect of missing the best trading days, how long it takes to recover from a crash, and more. Let’s check it out…

Keeping your investment fees down is vitally important. Make sure you have the best investment platform for your circumstances. Don’t forget to check out the curated list of the best Stocks and Shares ISAs, along with free stocks and other discounts.

Watch The Video Here > > >

Are you comfortable investing when the stock market is historically high? Join the conversation in the comments below.

Written by Andy


Featured image credit: lucadp/Shutterstock.com

Also check out the MoneyUnshackled YouTube channel, with new videos released every Wednesday and Saturday:

Future Investment Returns Are Expected To Be Dismal

How big will your investment returns be over the years ahead? We’ve seen some huge gains recently despite wider economic concerns, but can this continue? There is a foul smell in the air and there are reasons to believe that future investment returns will not be as good as they once were.

Today’s post is jam packed – we’re looking at investor expectations, historic returns, a worrying forecast by Credit Suisse, why young people are potentially screwed, reasons to be optimistic, and what you need to do.

Keeping your investment fees down is vitally important. Make sure you have the best investment platform for your circumstances. Don’t forget to check out the curated list of the best Stocks and Shares ISAs, along with free stocks and other discounts.

Alternatively Watch The YouTube Video > > >

Investors’ Expectations: Are Investors Living In Cloud Cuckoo Land?

In April 2020 Schroders commissioned an independent online survey of over 23,000 people who invest from 32 locations around the globe. From this we learnt that investors on average expect to pocket returns of 10.9% a year over the next five years.

Oddly, this was 1.0% higher than what was expected 2 years prior. Bear in mind that this study was being carried out around the time when Covid was kicking off and we would have thought this would have sent everyone into panic mode.

Winding the clock back, we recall mass hysteria and panic-buying leading to not just some empty shelves but literally empty supermarkets. Based on this you wouldn’t have thought that there was too much optimism in regard to stock market returns. Maybe the average investor is more positive than the average member of the public.

Although the average investor expects 10.9% annual returns it does vary based on region.

Most optimistic are those from the US. Our American friends are well-known for their confidence and in this case, they expect 15.4% annual returns. Let’s hope they’re right – but something tells us this is a fantasy. Some way behind but still massively hopeful are UK investors who expect 11.1% returns annually.

To quote the study, “People have an over-optimistic outlook on their total investment returns.”

Why Are Expectations So Unrealistic?

The Schroders study only briefly touches on why they think investor’s expectations are so high. They conclude that the majority of people are basing their predictions on the returns they received in the past. With huge returns in recent years, especially in the US stock market, you can easily see why this might be the case. Most people have a tendency to show Recency bias.

Recency bias is where someone gives greater importance to more recent events. History tells us that economies and stock markets move in cycles, but it’s easy to forget that when you have 10 years of solid investment gains. Instead, people begin to believe this will continue, especially if they’re new to the game and it is all they’ve ever known.

We also think that the industry and the media like to portray the stock market as a place to get rich quick. It’s the standout performers that make all the headlines. In the UK, Scottish Mortgage has returned around 742% in just 10 years. While over in the US, Tesla has grown over 1,200% in 5 years.

We all want these standout returns but sadly, these aren’t the norm.

Historic Returns

Each year Credit Suisse publish the Global Investment Returns Yearbook – a detailed analysis on investment returns going back over a hundred years.

According to the study, over the last 40 years the World bond index has provided an annualized real return of 6.2%, only marginally below the 6.8% from world equities.

The authors go on to say that “extrapolating these bond returns would be foolish as it was the golden age for bonds, just as the 1980s and 1990s were a golden age for equities.”

Although 40 years seems like a long enough period to form a solid conclusion about returns, unfortunately it isn’t. Stocks and bonds are volatile, which leads to major variation in returns. Fortunately, the study goes back 121 years and they found that US equities returned 9.7% before inflation and 6.6% in real terms. Whereas US Treasury Bills only provided 0.8% real returns.

With the power of compounding and 121 years these differences are enormous. With stocks the purchasing power has grown by 2,291 times but only 2.6 times with treasury bills. If you were thinking about investing in short-term bonds that might make you think twice.

Other stock market studies will vary slightly, and we have long held the belief that stock markets have returned around 8% before inflation and 5% after inflation as a conservative measure. So, with the world’s biggest market delivering stellar results in excess of our expectations it gives us a reason to be optimistic.

The US has been the major success story though throughout the 20th century and the beginning of the 21st, so focussing on its performance might not be a fair representation of the overall stock market.

Over the same 121 years UK equity returned 5.4% in real terms. Not bad and on an annual basis not too far behind the US powerhouse. However, compounded over 121 years, a small difference like that makes a huge impact.

Where US equities’ purchasing power has grown by 2,291 times, UK equity has grown by just 572 times.

The study carried out this exercise for 26 countries and found that real equity returns were typically between 3% to 6% per year.

Dismal Returns Forecast

So far we’ve seen that most investors have unrealistic return expectations, while our own are more in line with historical averages, but maybe this is where things are about to get ugly.

According to the same Credit Suisse study, the authors are forecasting an enormous drop in expected returns over the coming decades, which could devastate all our plans to grow wealth and shatter our retirement dreams.

Their method takes current bond yields to indicate future bond returns. Then using this figure, they have forecasted equity returns by adding on their estimated equity risk premium. The result is that they are expecting bonds to have a negative real return of -0.5% and equities to return just +3% after inflation. Just 3%!

If that wasn’t depressing enough, when you run those returns through a 70:30 equity/bond blend as a typical portfolio might look like, the portfolio real returns are a horrifying 2%.

This same blended portfolio would have returned in real terms roughly 6% for previous generations, meaning future returns could be two thirds smaller than what our parents and grandparents’ generations could have earned.

Gen Z & Millennials Are Screwed

If the investment forecasts in the Credit Suisse report turn out to be true, this paints a very dire picture, especially for young people. But this isn’t the only way in which young people are being screwed.

Young people are already having to contend with a property market where house prices have reached what can only be described as ridiculous. Official data says the average UK house is now valued at £267,000, which is a 7.6% annual price rise. We’re betting that most of you haven’t had a 7.6% pay rise this year.

Next, Youth unemployment is already unacceptably high at 14.3%. Young people who find themselves lucky enough to have a job are being thanked for their services with meagre wages. ONS data says the average income for a 20–24-year-old is just £18,400 and only £23,900 for a 25–29-year-old.

Further, Government debt is at eyewatering levels at around £2 trillion. Although high earners are likely to bear the brunt of this in the form of increased taxes, it is the young who will suffer the most. The country will have less money sloshing around that otherwise would have been spent on boosting education, job prospects, and ultimately creating better opportunities.

Also, most people under the age of 40 probably haven’t given too much thought to state pensions but this could prove to be a big mistake.

It’s widely believed that the UK government will not be able to sustain the state pension due to the enormous running costs, which are currently estimated to be around £100 billion a year and climbing. It’s highly likely that it won’t exist in its current form for our generation and those younger.

Reasons To Be Optimistic

Going back to investing returns, there have always been reasons not to invest.

Considering the economic state we find ourselves in it is difficult to disagree with the forecasts put forward in the Credit Suisse report. However, the world moves so fast that we wouldn’t pay too much attention to forecasts that look much further than just a few years.

Would someone in 1950 have predicted the moon landing? Would someone in the 60s have foreseen the internet? Would a 1980s forecaster have predicted that everyone would carry a supercomputer in their trouser pockets within just a couple of decades?

But if these forecasts turned out to be true, a period of low investment returns COULD prove to be a blessing in disguise. When you are young and buying into the stock market it is better when prices are low. Low returns over the next decade would suggest stocks will become better value than what they are today.

Ideally you would want the stock market to go nowhere or even fall while you in the accumulation stage, and then surge right before you wish to start drawing on that retirement pot.

Everyone knows the phrase buy low, sell high, but why does everyone cheer every time the stock market goes up? Unless they’re selling and never buying again it doesn’t make any sense.

Another reason to be optimistic is the reduction in investment fees and improvement in accessibility to the stock market. Past generations may indeed have had much better returns, but they also suffered punishing fees, which would have severely dented any gains. Today we can eliminate fees almost entirely. We can invest in stocks from all over the world for less than one tenth of a percent.

What To Do If Returns Are Dismal?

In terms of our investing style, what we’re doing is accepting more risk, and by that we mean more volatility. The days of getting sweet returns with zero risk are gone. That means we will allocate more of our portfolios to “riskier” assets such as stocks instead of bonds. Bonds provide stability but not the required gains that we need.

Next, we are already allocating a big chunk of our portfolios to emerging markets and small-cap stocks. We’re hoping these themes perform better than larger caps from developed economies and might give our portfolios the boost we need.

It’s essential to keep investing – even at the point of maximum pessimism. Next time the stock market is making the front pages with tales of doom and gloom – buy, buy, buy!

Unfortunately, if returns are going to be dismal, then it’s so important to invest more. If your pot is going to be hampered by low returns, to counter this you can either invest for longer and/or increase contributions.

Our chosen route is to build multiple streams of scalable income, which is where the output reaches a growing audience. As a result, the income is effectively unlimited. We are building scalable income alongside investing, but in theory if you can build this large enough you may not even need to rely on investing to set you free, and so low returns shouldn’t matter too much.

The best thing you can do is concentrate on building that income and channelling it into the stock market.

What do you think investment returns will be? Are we about to have a decade of dismal returns? Join the conversation in the comments below.

Written by Andy


Featured image credit: trendobjects/Shutterstock.com

Also check out the MoneyUnshackled YouTube channel, with new videos released every Wednesday and Saturday:

Reviewing My Property Empire – Is Buy-To-Let Still Valid In 2021?

Written by Ben

I’ve been reviewing my property portfolio recently, in light of the covid pandemic.

Over the last year, landlords have endured loss of rents, illiquid markets and rising prices stopping them from expanding their portfolios.

Rishi’s stamp duty holiday has been of little use at the lower end of the market where the 3% Buy-To-Let surcharge still applies.

There was SOME help, like the mortgage payment holiday which I personally took full advantage of, as so many landlords did, and the furlough scheme to help struggling tenants pay rent.

But of the damage done by the lockdowns, how much is reversible with the reopening of society, and how much represents a true body blow to property investing?

Luckily, Paragon Bank have done some detailed analysis of the market which we’ll draw on as we go, for those of you who love a good chart.

We’ll briefly look at how my properties have fared since I started down the Buy-To-Let path, plus we’ve packed in a boat-load of statistics to show what the outlook is like going forwards for British landlords.

In doing so, we’ll find out whether Buy-To-Let is still valid as an investment in 2021. Let’s check it out!

Next time you need to switch energy provider, try out Octopus and get £50 cash back when you use this link.

Octopus are rated 4.8 Star Excellent on Trustpilot with over 50,000 reviews – check them out.

Watch The Video Here > > >

Do you still see Buy-To-Let rental property as a valid investment in 2021? Join the conversation in the comments below!


Featured image credit: OlegRi/Shutterstock.com

Also check out the MoneyUnshackled YouTube channel, with new videos released every Wednesday and Saturday:

How To Build The Perfect Vanguard Portfolio

Vanguard is one of the best providers of index funds and ETFs. So much so, that Vanguard seems to have built up a cult following.

Pick up any investment book, watch any YouTube video, or submerge yourself into any online investment article and more times than not, Vanguard will be touted as the go to place to build your wealth.

And to be fair, this is probably justified. We have always felt that Vanguard has the customers best interest at heart, which is extremely rare for a corporation.

Call us cynical but other corporations, no matter what industry they’re in, seem to pretend to care for the customer and then pull the rug out from under their feet.

In this article we’ll briefly look at why we think Vanguard funds and the Vanguard investment platform are great places to invest.

We’ll also consider some of the key areas where we think Vanguard are underdelivering and why you might want to go elsewhere for certain investing objectives.

And we’ll also suggest 6 portfolios built exclusively from Vanguard funds, to use as inspiration for your own portfolio.

You might find that it’s cheaper to buy Vanguard ETFs on a free trading platform like Freetrade, than on Vanguard’s own platform. Check out Freetrade’s welcome offer of a free stock worth up to £200 on the Money Unshackled Offers Page.

Alternatively Watch The YouTube Video > > >

Why Invest In Vanguard Funds?

Let’s first consider Vanguard’s funds and ETFs. Their fees are amongst the lowest in the industry and their funds some of the most popular – which means you should have no problem buying and selling, as they are what the industry call very liquid.

In the past we have referred to Vanguard as the Amazon of the index investing world.

When you shop at Amazon you know that you will get a good price. It may not always be the very best, but you can shop with confidence without having to do any price comparisons.

Vanguard is exactly the same. Across their entire range you will always get a competitively priced fund or ETF.

Not only that but in the UK, Vanguard has a very streamlined range, focussing on simplicity, which we feel are specifically targeted at the most important investment markets such as the whole-world and key geographical regions.

What Are The Problems With Vanguard Funds?

The simplicity of the range is a blessing for beginners who might otherwise drown in some of the choice offered by competing Fund and ETF providers.

However, for those a little more experienced, this smaller range really limits what you can invest in.

The most notable absences are a lack of precious metals, sector-based ETFs, currency hedged equity ETFs, synthetic ETFs, small-cap ETFs, and the absence of a dedicated global government bonds ETF.

That is quite a long list of omissions, but you don’t have to exclusively invest in Vanguard funds. You can easily invest primarily in Vanguard funds and then supplement them with investments from other fund providers.

The exception to this is if you invest via Vanguard’s own investment platform.

The Vanguard Investment Platform

When Vanguard launched its UK investor platform in 2017, at the time it was a game changer. They allowed investors to invest with platform fees of just 0.15% and no trading fees. For investors who were only interested in investing in a few Vanguard index funds and ETFs there was no better place to invest.

Since then, they have introduced Self Invested Personal Pensions, and now offer 4 account types in total: ISAs, Junior ISAs, General Accounts, and SIPPs.

Today, however, commission free trading apps are also providing some much-needed competition. Even if you are only interested in investing in Vanguard funds, in some cases it would be better to use a third-party platform.

Trading 212 and Freetrade both offer a wide range of Vanguard ETFs but with zero account fees, so might be more cost-effective ways to invest in Vanguard ETFs.

Freetrade do charge a flat ISA and SIPP account fee though so don’t forget to factor that in.

Strangely, Vanguard’s own platform doesn’t offer the full range of Vanguard funds, which is SO annoying!

For example, the FTSE All-World ETF (VWRL) is only available as a distributing ETF, but on third party platforms such as Interactive Investor you will have the option to choose the accumulation variety (VWRP) as well.

Portfolio Models

There’s lot of theory around building the perfect portfolio and the one we subscribe to is owning the entire world.

Vanguard clearly agree with this as their fund range is mostly broken down into regions, which makes building a global portfolio super easy.

Portfolio 1: Global Tracker

There’s a good argument that an investor’s biggest enemy is themselves. The vast majority of investors underperform because they can’t help but meddle.

They listen to the news, they buy into the fear mongering, they try and predict what will and won’t do well, and on and on the portfolio damage goes.

Instead of this doing all of this, it might be better to just pick one fund and leave it at that. Our favourite Vanguard funds for doing this are: the Vanguard FTSE All-World ETF (VWRL/VWRP); or Vanguard FTSE Global All Cap Index Fund.

The All-World ETF costs just 0.22% and covers over 3,500 stocks across the globe.

The US makes up the bulk of the fund with 56% of the allocation, Japan makes up 7.3%, China 5.3%, and the UK 4.1%.

Over the last 5 years the ETF has returned 94%, which is neck and neck with the benchmark. The ETF has not yet existed for 10 years, but the benchmark’s 10-year return is 133%.

This index and ETF tracks both large and mid-cap stocks and covers around 90% of the investable market capitalisation.

The Vanguard FTSE Global All Cap Index Fund is very similar but also includes small-cap stocks, which takes the stocks in the fund to over 6,800.

Although this sounds like a lot more stocks than the ETF contains, these will make up such a tiny allocation of the fund that they will only make a small difference to performance.

As it happens, over 5 years the benchmark return for the All-World ETF is 94.1% compared to 96.3% for the Global All Cap Index Fund.

Portfolio 2: Developed And Emerging Market Tracker

This is probably our favourite Vanguard portfolio. It takes all the good points from the previous portfolio and adds in a little more control and even lowers the fee. The ETFs to use are: Vanguard FTSE Developed World ETF (VEVE/ VHVG); and Vanguard FTSE Emerging Markets ETF (VFEM / VFEG).

The FTSE All-World index effectively contains both the FTSE Developed and the FTSE Emerging Indexes at about 88% and 12% respectively.

If you buy these ETFs in these allocations, you would in theory beat the FTSE All-World ETF because the combined weighted fee is cheaper.

The Developed World ETF costs just 0.12% and the Emerging Market ETF is 0.22%. Together that comes in at 0.132%.

However, we would choose to invest slightly more into the Emerging Markets – maybe taking the weighting from 12% to 20% – because we think the emerging markets will deliver stronger returns over the next few years. Doing this would change the total portfolio fee to 0.14%

Over the last 5 years both of these ETFs have performed similarly.

The Developed World ETF has returned 94.6% and the EM ETF has returned 97.1%.

The Developed World ETF is dominated by the US, followed by Japan and then the major European countries. The EM ETF is weighted heavily towards China and followed by large positions in Taiwan and India.

Portfolio 3: Regional ETFs

Another portfolio we like is one that’s built using individual regional-based ETFs. Something like:

  • S&P 500 ETF (VUSA)
  • FTSE Developed Europe ex UK ETF (VERX)
  • FTSE 100 ETF (VUKE)
  • FTSE Japan ETF (VJPN)
  • FTSE Developed Asia Pacific ex Japan ETF (VAPX)
  • FTSE Emerging Markets ETF (VFEM)

The fees for each ETF are dirt cheap. The beauty of this setup is you can put as much or as little as you like into each region. If you think Japan is cheap, buy more. If you think the US has silly valuations, buy less. You have so much control.

Portfolios 4 & 5: Ready-Made Portfolios

Vanguard has some wonderful funds of funds that are essentially one-stop-shops. They have built a range of low-cost, ready-made portfolios that will make your life a breeze.

The first set of ready-made portfolios is known as their LifeStrategy Range and each one costs just 0.22%. There are 5 different funds: LifeStrategy 20% Equity Fund, 40%, 60%, 80%, and 100%. The number indicates what percentage of the fund is in equity, with the remainder being in bonds.

Let’s look at LifeStrategy 60 as an example. Within the fund there are loads of other Vanguard funds. If you were to tally up all the bond funds in there it would add up to around 40%. The other 60% is in Vanguard equity funds.

One important thing to point out with this fund range is the UK bias. The funds are built roughly to follow global market capitalisation weightings but are distorted in favour of the UK.

We personally don’t care for this, but many UK investors do want some UK home bias.

The next set of ready-made funds are the Vanguard Target Retirement Funds, which all cost 0.24%. There’s a whole bunch of these and you choose the one with the name closest to your retirement date. For example, say you were planning to retire in 20 years’ time you would choose the Target Retirement 2040 Fund.

A traditional investing path is to de-risk your portfolio as you age. These funds achieve this by gradually moving your invested money away from equities and towards bonds – Vanguard does everything for you.

The Target Retirement 2040 Fund is still 19 years from its target date, so at this point it holds 74% equity and 26% bonds.

In exactly the same way as the LifeStrategy funds, the Target Retirement Funds are also weighted with UK bias.

Portfolio 6: ESG Fund

This is for the investors that want awesome returns but wish to do it responsibly. This portfolio consists of a single global ETF that tracks the FTSE Global All Cap Choice Index.

The Vanguard ESG Global All Cap ETF (V3AM) has literally just launched at the end of March 2021 and costs just 0.24%.

There is little info about the ETF listed on Vanguard’s own site – presumably because it’s so new.

But taking a look at the index factsheet tells us everything we need to know.  The index contains around 7,500 stocks with big allocations to all the usual countries in a global index.

The index applies rules-based criteria to screen out non-renewable energy companies, makers of weapons, and vice products such as alcohol, gambling, and tobacco, amongst other things. Companies are also excluded based on Controversial Conduct.

Its 5-year return is 110.5% – even beating the 99.5% from the FTSE Global All Cap.

Add-ons:

Other than the ready-made portfolios you may have noticed that we have neglected to include any bonds. That’s because we don’t think young people need them in their portfolios, and also because we feel that bonds are not good investments right now.

Bond prices are linked to interest rates, which are already at or below zero globally, and we can’t imagine there being any major drop in interest rates that would cause bond prices to go up. So, it seems that investing in bonds now would be the worst time to invest in this asset class.

Having said that, there’s nothing stopping you from adding some bonds to any of these portfolios. If you’re adding bonds in order to maximise portfolio stability, then we would stick to government bonds and avoid corporate bonds.

Corporate bonds tend to move in a similar way to equities and so offer little protection in a downturn. Government bonds, however, tend to be a good hedge against equities.

Unfortunately, Vanguard doesn’t offer a dedicated global government bond ETF. But they do have these more targeted ETFs which could be used instead:

  • USD Treasury Bond UCITS ETF (VUTY)
  • K. Gilt UCITS ETF (VGOV)
  • EUR Eurozone Government Bond UCITS ETF (VETY)
  • USD Emerging Markets Government Bond UCITS ETF (VEMT)

Similarly, you might want to tack on other ETFs to increase or decrease your exposure to certain areas.

For example, you could also invest in the Vanguard FTSE 250 ETF if you wanted more exposure to UK mid-cap equities.

Do Vanguard products make up the bulk of your portfolio? If not, what does? Join the conversation in the comments below.


Featured image credit: Piotr Swat/Shutterstock.com

Also check out the MoneyUnshackled YouTube channel, with new videos released every Wednesday and Saturday: