
What goes through your mind when you look at your payslip, and you see big slices of your money taken by the taxman?
Do you think “fair enough, I’m sure I’ll get that back in NHS treatments, state pensions, and pothole repairs” – or are you thinking you’re being asked to pay way over the odds compared to the size of the income that you make? Are you being mugged by the taxman?
Today we’re taking a look at who benefits when you pay your taxes, and whether or not you’re losing out based on your income level. In other words are you getting back more or less than what you put in?
We’ll take a look at whether the tax system is progressive, whether it’s fair, or whether it just punishes aspiration, and we’ll look at the actions you can take to keep the taxman’s hand out of your pocket. Let’s check it out!
Commission-free trading platform Stake are giving away a free US stock worth up to $100 to everyone who signs up via our link. Be sure to check that out.
Alternatively Watch The YouTube Video > > >
The Effect Of Tax On Your Income – From Poor To Rich
Let’s kick off with what percentage of their take-home pay people actually get to keep, depending on how much they earn.
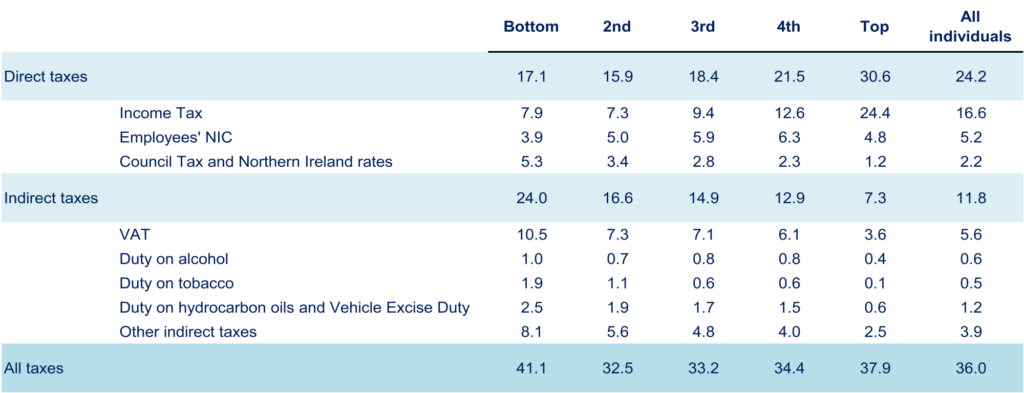
As you might expect, direct taxes are higher as a percentage of your income the more you earn. This makes sense when you consider that the higher income tax rate shoots up to 40% from 20% once you start earning a little over £50k.
Direct taxes include income tax and national insurance (which are payslip deductions), and Council Tax (which is a tax on your house).
If you get your income from a pension, dividends, or rent from property, those taxes are included in income tax.
Perhaps more surprising is that indirect taxes run in the opposite direction, with the poorest spending 24% of their incomes on indirect taxes – things like VAT and other taxes that apply when you buy things – while the richest spend just 7%. Maybe the rich are just able to save proportionally more of their incomes.
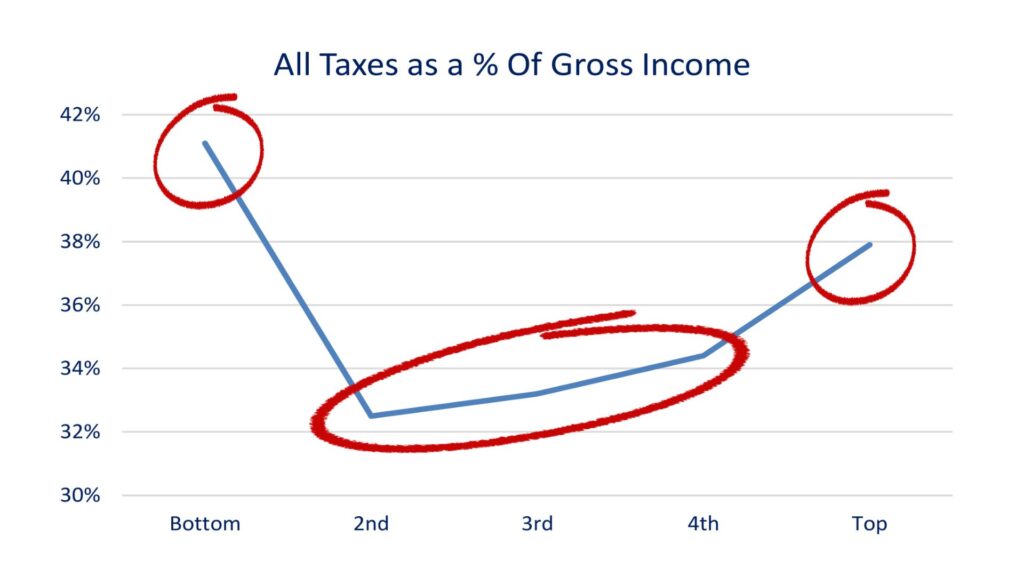
When everything’s added together, we see that the people being stung the most are the richest, but ALSO the poorest. While higher earners get stung on their payslips, lower earners are feeling the sting when they enter the shops. It looks like middle earners are doing ok. But this is not the full picture.
Are You Getting Back What You Pay In?
Next, we need to look at the value of what we get back from the taxman in terms of benefits. And here we don’t just mean things like the dole and the state pension.
The ONS makes reference to “Benefits-In-Kind”, which include things like the annualised cost of your state education spread over your lifetime, and the annualised cost to the NHS from having you as a patient over your lifetime.
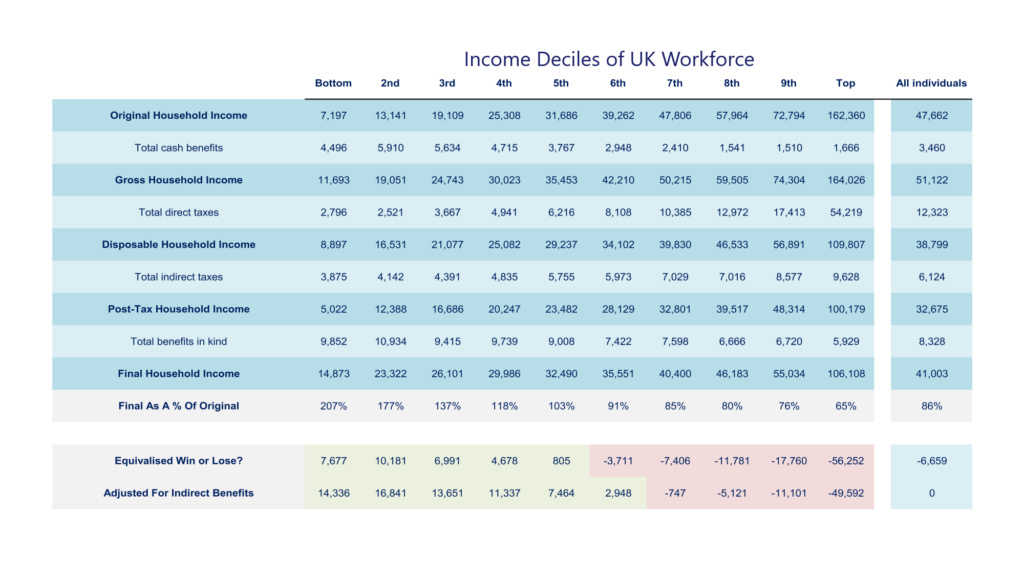
This table shows the average household incomes in 10% bands of the working population, from the poorest 10% of people to the richest 10% of people.
The top line is the equivalent of pre-tax salary – take a quick look and work out where your household sits on this line. Soon we’ll be telling you if you’re likely to be winning or losing to the taxman based on your income band.
Let’s look at the 7th decile as an example, which is the top 61-70 percent of earners. If you’re a regular visitor to our site we can assume that you one day plan to be at least this high up the income scale.
Total money earned for this average household in the 7th decile is just short of £48k, so a 2-adult household might contain a couple each with a £24k salary.
We don’t consider this to be particularly well-off – it’s a middle-income salary, which just about affords you a basic level of financial security.
The ONS adds to this £2.4k of benefits – things like entitlements to childcare and maternity leave, as an average annualised figure spread over your working life.
Then the taxman comes a’knocking for his first slice of your pie. £10.4k is immediately taken from you before you’ve even seen it. You lose out a further £7k indirectly, like at the shops when the taxman increases the price of your shopping basket by 20%.
But you do get a good chunk back in value from society. The cost of providing you with national services like the NHS and the school system are added back to give your theoretical Final Household Income. But at just 85% of the original, it looks like someone in the 7th decile is losing out to society.
Winners And Losers
So who’s winning and who’s losing? According to the data, the top half of earners are losing out to the tax system, while the bottom half of earners are getting a great deal.
What this doesn’t factor in though is the indirect benefits of national spending which aren’t easily apportioned out by wage bracket.
These include the value you get from the national debt (which has grown the country’s GDP), the value you get from the police and emergency services, from the army who defend us, from infrastructure like roads, and even the cost of the government (it’s arguably better than anarchy).
We’ve added these costs in equally on the assumption that the overall average win or loss for all citizens should be zero, on the further assumption that a country’s budget all boils down to its citizens’ incomes in the end.
What this means is that earners in the 6th decile are now beating the system, if only slightly, but people in the 7th decile continue to be expected to pay out more than they get back.
This is pretty much how we should expect a tax system to work, with the rich subsidizing the poor. But are a young couple on £24k pre-tax salaries in the 7th decile rich? Of course not – they’re middle earners, likely just barely scraping by.
But they are taxed as though they were rich, and are being asked to find room in their budget to subsidize everyone who earns less than they do.
So next time someone on a below average income moans to you that they are paying too much tax, educate them that they’re actually getting back heaps more in value than they pay out. It’s people in the 61-70% bracket and above who perhaps have the more reasonable cause for complaint!
What About When You Retire?
When you retire, does the benefit you get from the state pension and your greater dependency on the NHS mean you get to recoup some of your losses?
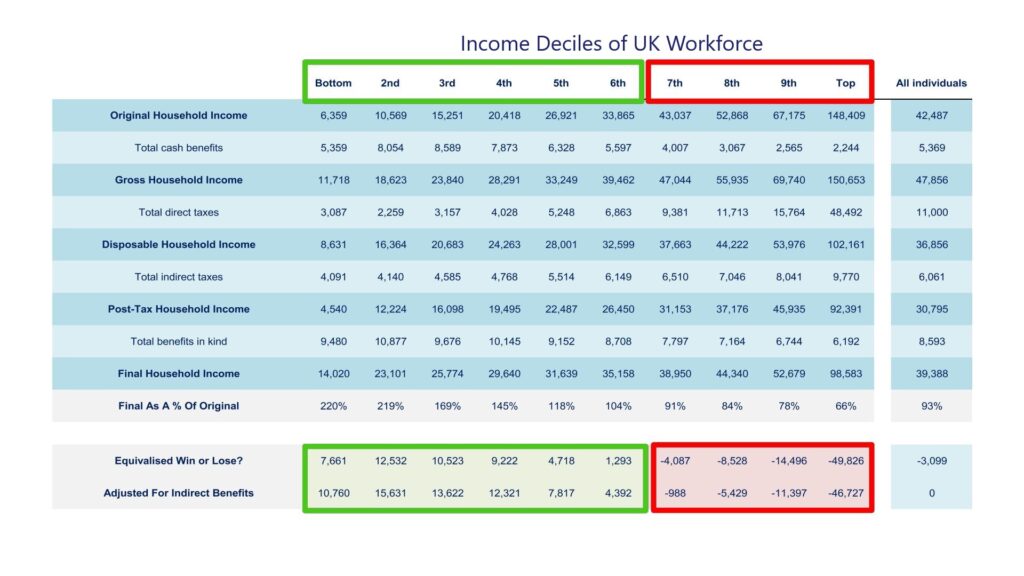
No, not really. Here’s the same data as before, but now including your expected state benefits in retirement, averaged out annually. The numbers have moved a little, but the bottom 6/10ths of people are still ahead, while everyone else continues to pick up the tab.
More Net Takers Over Time
Over the last 20 years, more and more people have moved from being net payers of tax to net receivers of tax. This might seem like a good thing, but in reality it means more people are becoming poorer and are in need of help from better-off taxpayers.
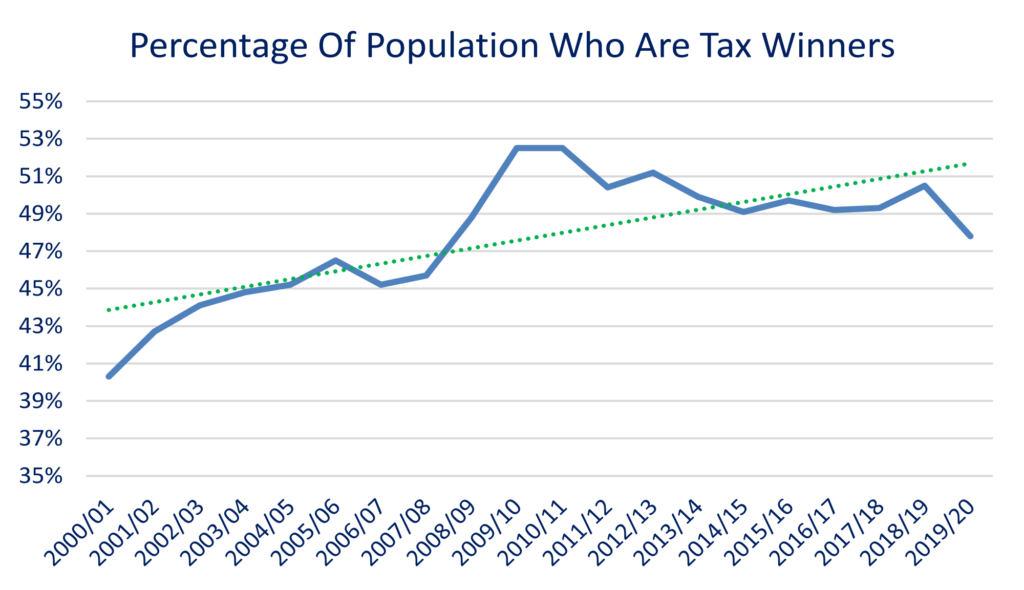
This chart shows it nicely, with the real figures in blue and the average trendline in green. This data runs contrary to the much-cited complaint by the less well-off that higher earners don’t pay enough taxes. The trajectory is actually that higher earners are being asked to subsidize an ever-growing majority of the British population.
Of course, the other way to read into this is that more people are getting better value from the tax system.
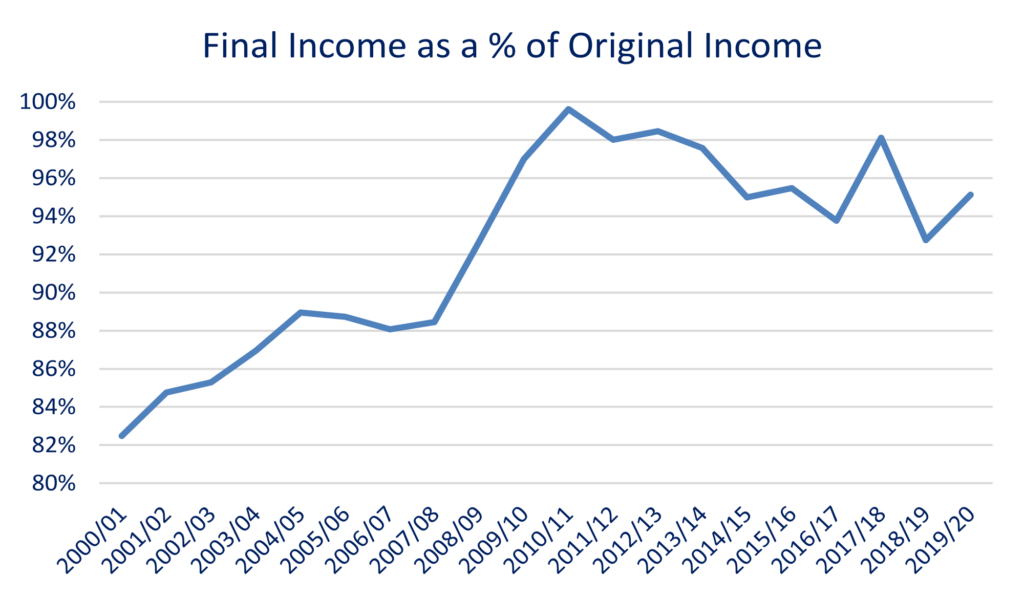
This next chart shows that on average, peoples’ final adjusted income is much closer to their original incomes than it used to be. Remember, final income is after adjusting for both taxes and the value you get from national services.
One possible explanation is that the tax burden for the average citizen has decreased over the years. Another is that the value they’re getting from the state has increased relative to wages. Which is it?
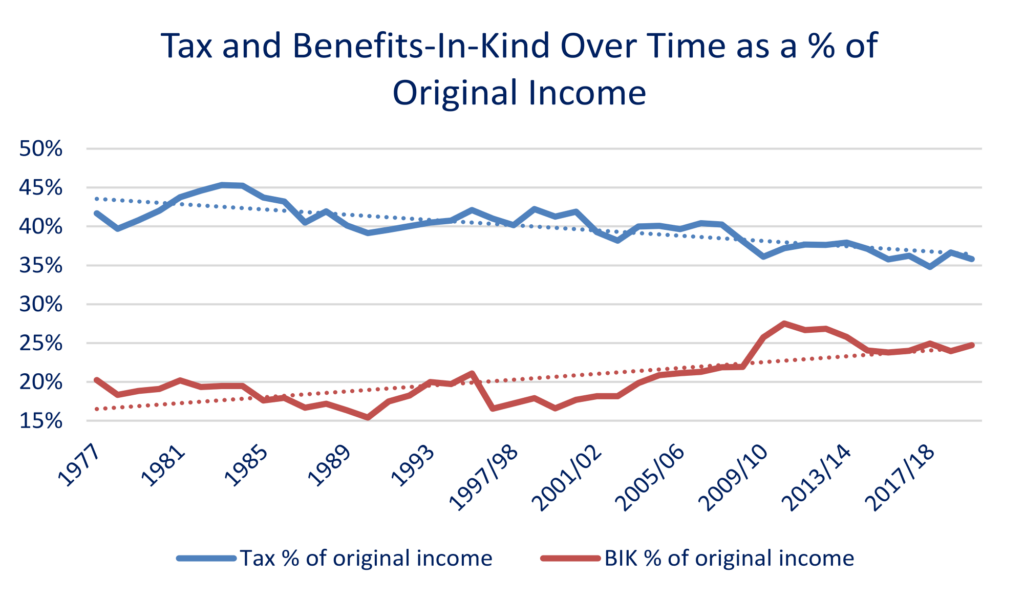
It’s actually a bit of both, according to the ONS data. Total taxes as a percentage of original income for the average person has been steadily falling as far back as this data goes, which is to the 1970s. Benefits-In-Kind, such as the per-person spend on the NHS and schooling, have been increasing over time.
Taken together, this suggests that the average worker is not being screwed by the taxman. But how do we reconcile these findings with the well reported fact that the UK’s overall tax burden is increasing?
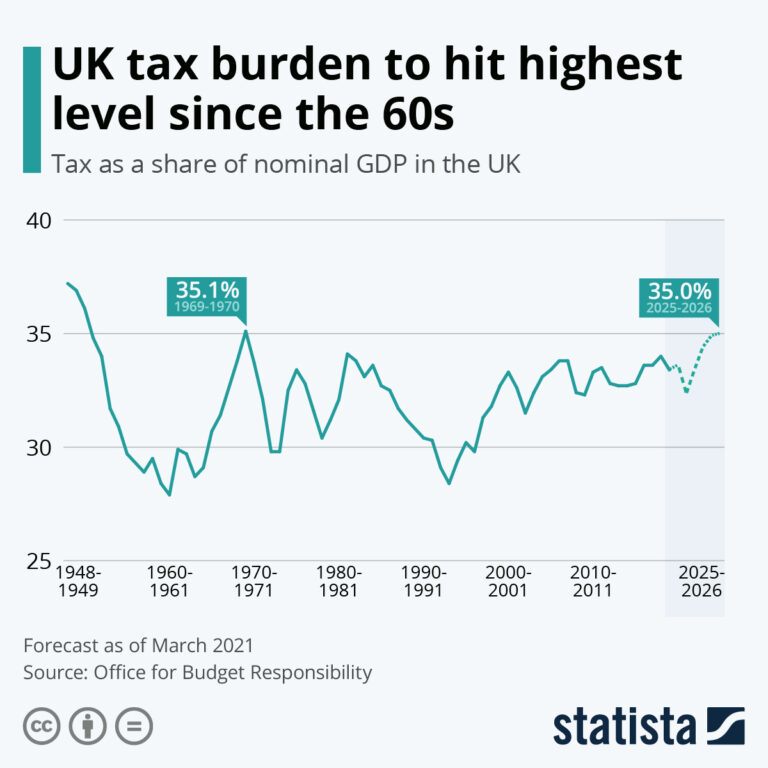
The Office for Budget Responsibility, another semi-governmental body, recently released the above chart which shows the tax burden for the UK as a whole increasing since the mid-90s. What are we to make of this?
If the average worker is getting slowly better off over time, and yet the overall tax burden is increasing, it must be either the richest or the poorest who are picking up the tab.
As we saw in Fig.2, it’s true that the poorest and the richest have the highest tax burdens. But the poorest get a sweet deal from the free use of our public services. So who’s taking the brunt of the increased tax burden?
The answer is in part the rich, but more so, the middle classes. According to the IFS, the bottom 42% of adults by income paid zero income tax in the 2019 tax year, thanks to generous personal allowances built into the UK tax code.
That’s nearly half of all adults! When we report that the tax burden has fallen for the average worker, this is a big part of the reason right here.
Meanwhile, the top 10% of earners contributed 61% of the UK’s entire income tax takings in 2019.
And while taxes on lower earnings have reduced, taxes at the higher end have been on the rise. The top 1% of taxpayers provided 24% of the entire country’s income tax receipts in 2008; in 2019, that had increased to 30% of all income tax receipts!
A Progressive Tax System?
It’s fair to say the UK tax system is progressive, in that the bottom half of earners get an amazing deal by being subsidized by those who earn better-than-average salaries.
Whether it’s a fair tax system is another matter, and we’ll let you be the judge of that.
Keeping The Taxman’s Hands Off Your Money
If you’re more inclined to think that the tax system punishes aspiration by going heavily after those with slightly better-than-average incomes, you might want to think about the following:
#1 – Paying The Taxman Second
As an employee, you get robbed by HMRC before your hard-earned wages have even hit your bank account. You can break free from this unfair system by being self-employed, or by incorporating as a limited company.
Many careers could exist within these tax structures. Have a think about your own line of work. Could you do a similar role, but as a contractor?
These structures also allow you to offset work expenses against your income. You can’t claim the cost of your petrol or your work clothes back as a lowly employee, but a self-employed contractor could, meaning they pay less tax.
#2 – Tax Advantaged Investments
Take full advantage of Pensions and Stocks & Shares ISAs. Every pound that you put into your workplace pension avoids unnecessary income taxes.
And any income or capital gains that you make within a Stocks & Shares ISA are yours to keep tax free. Even outside of an ISA, the tax rates on dividends and capital gains on your investments are much more generous than those imposed on employee income.
Our plan is to build our investments ISAs so big that we can live off the incomes that they produce. In theory, by doing this you could avoid having to ever pay direct taxes again. For more ideas on how to limit your personal tax burden, check out these 2 videos next, on dodging tax legally, and on limiting the taxes on your investments.
Are you winning or losing to the tax system, and do you think the system is fair? Join the conversation in the comments below!
Written by Ben
Featured image credit: supawat bursuk/Shutterstock.com
Also check out the MoneyUnshackled YouTube channel, with new videos released every Wednesday and Saturday: