

Where do you sit on the scale from poor to rich? How does your income and net worth compare to your neighbours?
These comparisons matter, because it is not the pound or dollar value of your wealth that matters, but what that wealth can buy you relative to everyone else.
You don’t need “X millions” to be rich – you just need more resources than most other people in the same economy.
Is a squirrel rich if it has 20 nuts? Well, he’s richer than his mate who has 5 nuts – the big squirrel next door is richer with 25 nuts, but you’d still say that our squirrel had a lot of nuts.
In this article we’re looking at income and net worth percentiles, and where you sit on the scale. Is your wage good, or not? Does your pension pot set you apart?
In theory, you only need to be doing better than most other people to live a comfortable life and retirement.
If you’re between the 50th and the 99th percentile it means you’re above average, and have a larger slice of the pie than most.
Between the 1st and 49th means you’re below average, and have some work to do to set things right!
So what is a good salary and a good net worth for someone in the UK?
What’s A Good Salary?
The Institute for Fiscal Studies has a handy calculator on their website for calculating your Income Percentile.
To qualify as above average, a single person would need to make £20,000 a year after tax – the equivalent of a £24,000 salary.
This would put you in the 51st percentile, just above average. But is that really enough to live comfortably?
According to RecruitmentBuzz, to be able to start saving just £100 per month you’d need a salary of £28,000 – or £22,700 after tax.
But to stand a chance of saving up for a house deposit, or a good-sized investment portfolio while you’re still young, we think you need to be saving at least £500 a month.
Extrapolating from the RecruitmentBuzz figures, we calculate the salary that allows this level of saving in the UK is £35,000, or £27,400 after tax, and this assumes the individual is not prey to lifestyle creep or lifestyle inflation.
This puts you in the 74th Income Percentile – the top 26% – meaning that to get ahead in life you need to be doing better than nearly three quarters of the population.
Not All Income Is Created Equal
You might be tempted to pat yourself on the back right now if your income puts you in a high percentile.
But is income from a job the same as income from dividends, or from rental property that you own?
Of course not. You might be in the bottom 40%, but if all your income was coming from passive sources, like stocks and property, you’d still be better off than someone in the 70th percentile or top 30% who gets all their income from a job.
Why? Because your passive income means you can probably retire whenever you want, or have unlimited free time to pursue more income if you chose to.
The guy making a decent salary in the 70th percentile – the top 30% – might still be chained to his desk for another 40 years. We’d say, it’s more important to own financial assets. Which leads us to: what is a good net worth.
What’s A Good Net Worth?
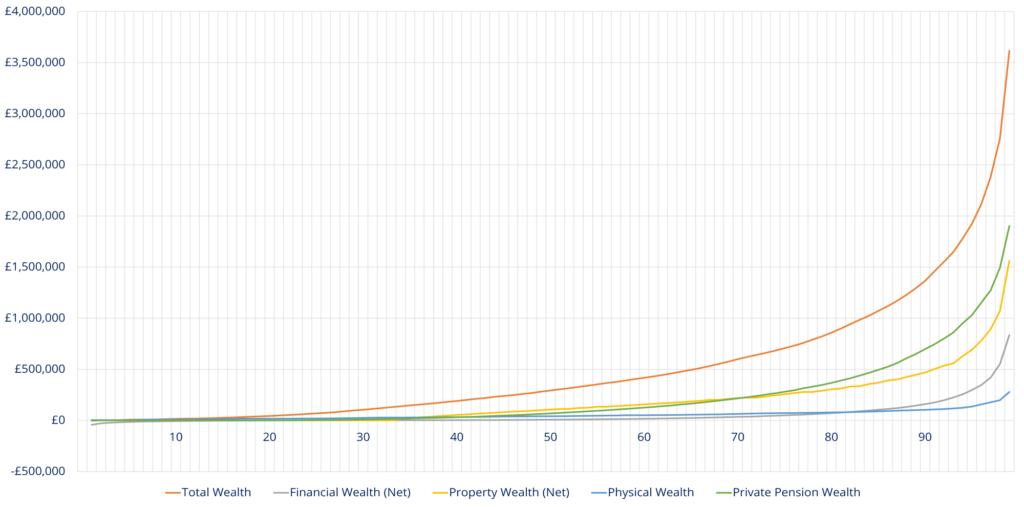
Above is a “UK Wealth By Household” chart which uses data from the ONS, which we’ve adjusted for inflation to 2020 as ONS data is typically out of date by 3 or 4 years.
This orange line is Total wealth, which is made up of the 4 underlying wealth types: Financial Wealth (investments and savings); Property Wealth (the value of your home); Physical Wealth (shiny things you own like cars, jewellery and fridge freezers – what Rich Dad Poor Dad refers to as “Doodads”); and Pension Wealth (the value of your private work pensions and SIPPs, not including the state pension).
The graph gets a bit mental after around the 65th percentile – the top third of people having so much wealth that it’s difficult to even see what’s going on below that, so let’s now zoom in on wealth up to £500,000.
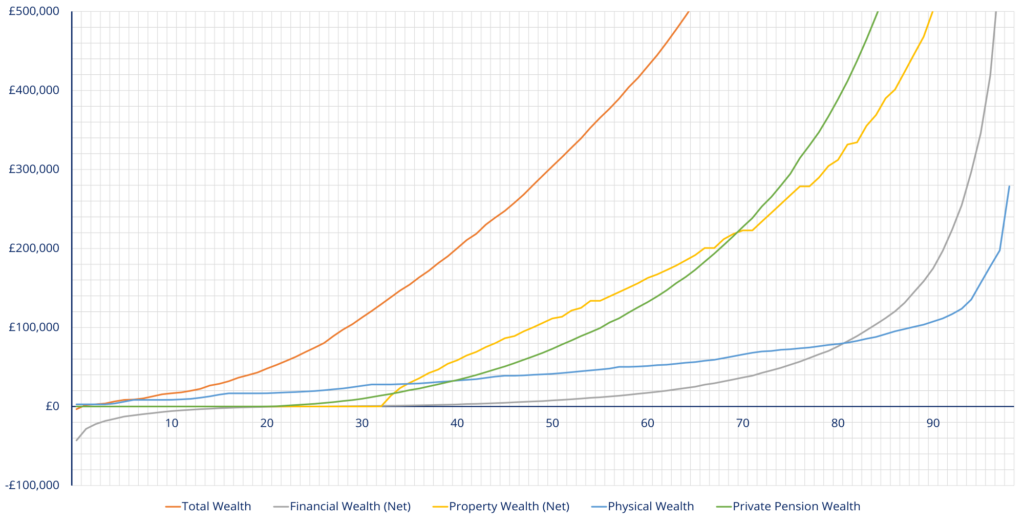
A household – whether that’s just you, or as a couple – with Total Wealth of £300,000 would find themselves on the 51st percentile – better than average.
That may sound crazy to a 30-year-old audience, but bear in mind this chart includes older people who have paid off their mortgages and built up significant pension pots.
We’re not fans of this focus on Total Wealth. Again, not all wealth is equal, and someone whose £300,000 is made up of highly depreciating Physical Wealth like new cars is obviously not as well-off financially as someone who owns £300,000 of Financial Wealth, like an investment portfolio that generates an extra £30,000 a year.
Let’s now break down the types of wealth that make up a Net Worth, and see which ones really matter.
#1 – Financial Wealth
This is your stocks and ETFs, your investment property, your cash and savings accounts, peer to peer lending accounts, gold, bonds, businesses that you own – all your money and things which substitute for money like investments.
Put the kettle on and tot up all your financial assets, then find your household on the chart – and we’ll zoom in again as most households will have less than £100,000 of Financials.
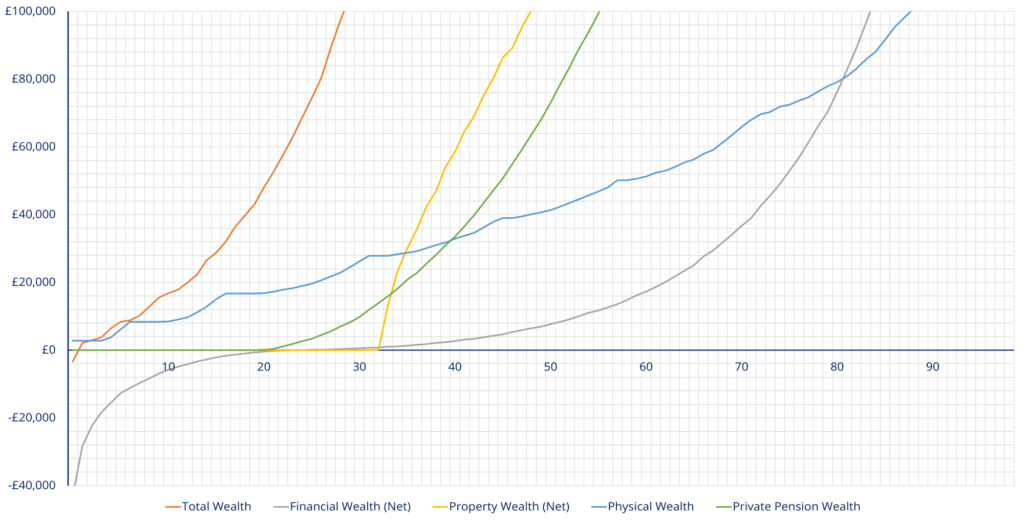
Your Financial Wealth is net of any debt, meaning the worst-off 25% of people have zero or negative Financial Wealth.
If you have a stocks and shares ISA or even a bank account with £8,000 in it, and no debt, you are above average.
The ONS data does not subtract your Rainy Day Emergency Fund from these numbers though, which should probably be around £8,000 for most people – around 6 months wages.
So what the chart is really saying is that half the country don’t have any spare cash for investing.
If you have built up any kind of investment portfolio alongside your emergency fund, you should consider yourself winning!
Financial wealth has the potential to generate more wealth, and can allow you to retire before age 55 if it’s large enough, or allow you the freedom to start your own business without having to worry about paying the bills in the initial years.
Passive income generated from it may even improve your standing in the Income Percentiles.
It can be difficult to value at the more affluent end of the population as rich people tend to own businesses which have no obvious market value, but generate them an awful lot of money.
Furthermore, income producing investments held within an ISA will be part of the Financial Wealth category, but a noteworthy point is that the income produced doesn’t actually classify as income in the eyes of HMRC.
It is unclear from this data whether this is counted as income or not, so it might be ok to be on the low end of the income percentiles, as long as you are on the high end of the Financial Wealth percentiles.
For most people, working out their Financial Wealth is as simple as looking at the balance on a savings account.
For a lot of people, their Financial Wealth will be held entirely in cash, and while this could be used to buy passive income assets with, most people won’t, and will instead convert any temporary Financial Wealth into Physical Wealth.
#2 – Physical Wealth
Physical Wealth is wealth that has been trapped in “stuff” – cars, coats, cots and other crap. To further quote Rich Dad Poor Dad, these are Expenses, not Assets, and typically decrease in value – by around half on the very first day of ownership in many cases.
Tot up your physical wealth and see where you land relative to your fellow countrymen – it’s the blue line.
What’s sad is how much more value people place in Physical Wealth than Financial.
A majority of people happily place tens of thousands of pounds into doodads, while utterly neglecting their finances.
#3 – Private Pension Wealth
Let’s now look at Private Pension Wealth.
It’s obvious in from the charts just how much more of a priority is given to pensions investing (the green Pension Wealth line) over accessible investing (the grey Financial Wealth line).
If you don’t know where you fall on the line, you are not alone. Barely anyone of working age has a clue how much money is invested in their work pension pots or what it’s invested in.
Maybe you don’t even remember how many pensions you have?
We did a deep dive video on exactly what was in one of (MU co-founder) Ben’s workplace pensions, and were horrified by the inefficient and undiversified way his money was being put to work by incompetent pension fund managers.
Ben has since opened a SIPP to hold all his old work pensions in, so he can control them more directly.
Check out that video for ideas about the SIPP providers you could open with, and why it’s so important to take control of your own money.
And if you open a SIPP with Nutmeg using our link you will get the first 6 months without management fees when you either deposit or transfer at least £500 – the link is on the Offers page.
The charts tell us that the average person (50th percentile) has a pension pot of £68,000. If you have more than this, you’re probably either over 40, or you have a very generous employer, or you have focussed relentlessly on your Pension Wealth to the detriment of your Financial Wealth, necessary for retiring before age 55.
#4 – Property Wealth
Unfortunately, the orthodox view in the subject of financial security is still that your home is your greatest asset. This is absolute tosh! Poppycock of the highest order.
Far too much focus is placed by wealth seekers on non-income generating assets like your home.
You could be a millionaire on paper because of your house’s value, but have no cash in the bank, and no stocks or other assets paying you an income.
You still have to go to work every day to pay the bills. The value trapped in that house makes your net worth look good on paper, but is pointless for any real-world application.
Your home, once paid off, is kind of an asset, so far as it stops you from having to pay rent, or mortgage interest.
But while Financial Wealth and Pension Wealth are more clear-cut Assets that generate additional wealth, Property Wealth can be more easily likened to a Liability. Of course, we’re only talking about the house you live in. Property held as an investment sits in your Financial Wealth box.
Your home doesn’t do anything to generate more wealth, and it costs you a lot to maintain. If you own a big house, you’re going to need a big income to pay for big maintenance bills and running costs.
And it can’t be easily sold to get hold of the money. You have to live somewhere, so selling your house to live on the cash is pretty unrealistic as far as plans go.
Only by downsizing or moving to a poorer area can you get access to that trapped value.
Take a look where you sit on the yellow line – and this is only the part of the house that you own, not the bit the bank owns with your mortgage.
For a new homeowner with a 10% deposit on a £200,000 house, you would own £20,000 of that house, and be in the 34th percentile – or bottom 34% of people.
Below the 33rd percentile – the bottom third of the country – households do not own any property, and rent instead.
Age Matters
The big dividing line between the haves and the have-nots is drawn through the generations.
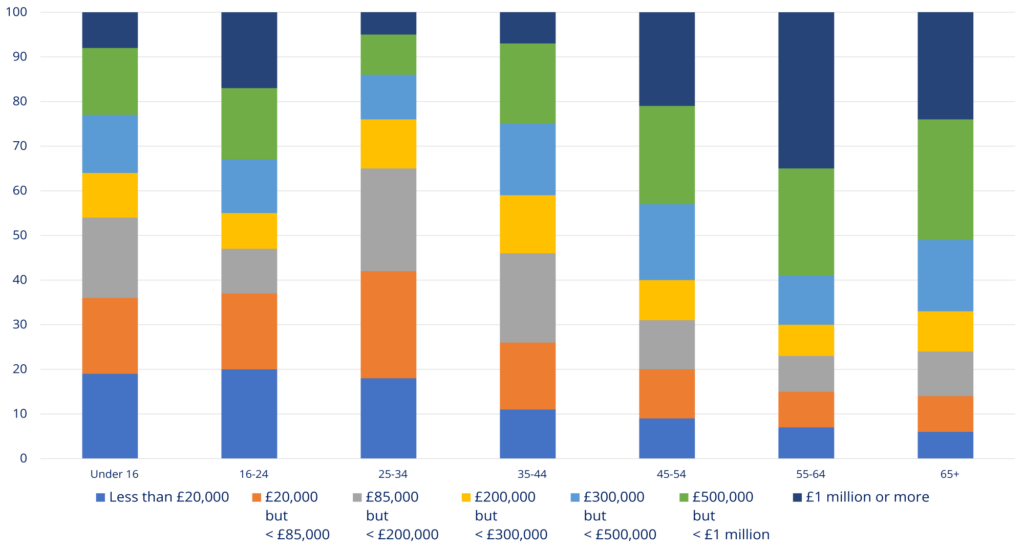
This chart shows this divide vividly. The average over-65-year-old has access to at least half a million pounds of total wealth – we can see the 50th percentile hits the green bar, which represents £500k to £1m.
Meanwhile, down at our end of the age-spectrum, the average 25-34 year old can command somewhere between £85,000 and £200,000 of total wealth.
Compare and contrast to the first chart we saw on Total Wealth. While there, the average person in the UK may have £300,000 of wealth, for the 25-34 age range, the average is just over £100,000.
So don’t feel too bummed out if you’re not on the property ladder yet, or if you haven’t built up much in the way of investments.
There’s time to turn it around and grow out of average. Get there faster by focusing on the right types of wealth – and the right types of income!
Tell us what you think your income and wealth percentiles are below!
Also check out the MoneyUnshackled YouTube channel, with new videos released every Monday, Thursday and Saturday:


2 Comments
Interesting read.
Maybe you could add a calculator in where you enter your total wealth and this tells you where you stand in the overall wealth divide!
For example £1200000 (I don’t have this by the way) would putyou in the top 5%.
Regards. Phil.
Always looking for calculator ideas so great, thanks for this. Have you seen our Fire Calculator (link in bar above)? Let us know what you think. Cheers, Ben
Comments are closed for this article!