Stocks and shares are constantly going up and down in value. If you can’t stomach this volatility, then you need to keep away…well away. But if you do this you will regret it. Having your money invested in the stock market is the easiest way to make your money work hard for you, rather than you having to work hard for money.
We wrote this during the beginning of the Coronavirus stock market crash and time will tell if it was a flash in the pan – or conversely – far worse. Either way we are confident that this is just another minor blip on the stock market’s march to ever greater heights and gives you an awesome buying opportunity. Price volatility is your friend if you are brave enough to strike.
Keep Calm and Buy More
We don’t know whether stock markets will be down further in 1 years’ time but in 5 years’ time it’s likely to be higher, in 10 years it’s almost certain to be higher and in 20+ years it’s practically guaranteed – and you will of course have collected some juicy dividends along the way.
And in a way it’s these dividends that reduce the risk of investing. The FTSE 100 hasn’t had the best 20 years, which is why it’s so important to diversify and why we have always encouraged world-wide investing as seen in our ‘How to Own the World’ series. Other indices around the world have fared much better over this time period, which highlights just how important it is to own everything.
Anyway, we’ve done some serious analysis on the FTSE 100, and our findings demonstrate that selling after a crash is the worst thing you can possibly do. Let’s check it out…
Editor’s note: Don’t forget to check out the Offers page where we have hundreds of pounds of cash bonuses that you can snap up when you sign up to any of the investment and P2P Lending platforms listed – including on the Nutmeg robo-investing platform; one of the easiest ways to buy into and take advantage of the low market right now!
YouTube Video > > >
FTSE 100 Over the Last 20 Years
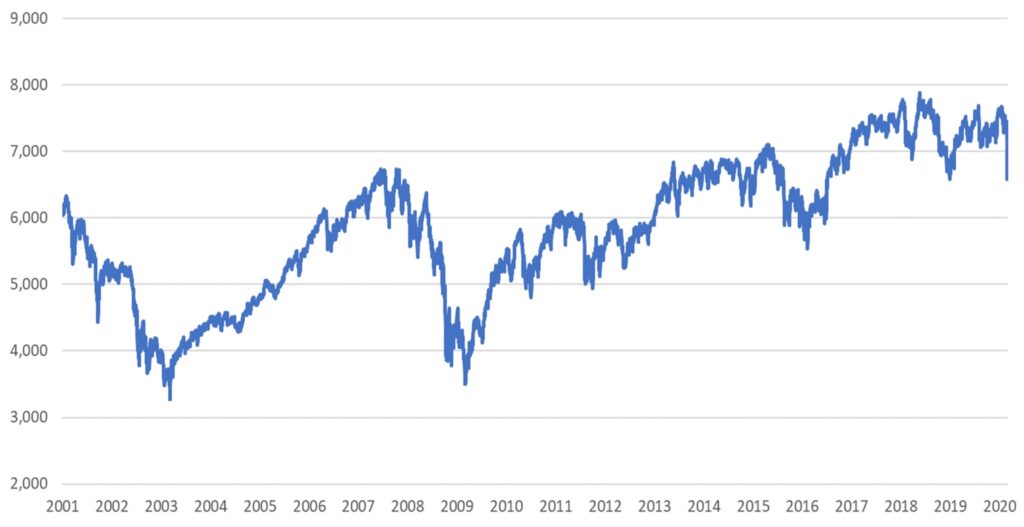
Below is the FTSE 100 for almost 20 years, which shows a pretty bleak picture. But it at least shows that that after every crash it does eventually climb above its previous high.
And to be honest unless you had bought in at the peak of the market it’s not a problem at all.
And by buying regularly, known as pound or dollar cost averaging, you average out your purchase price meaning your average purchase price is never the top of the market.
FTSE 100 Price History Over 20 Years
By this logic a big price fall such as what we’ve seen in February 2020 due to Coronavirus gives us an incredible buying opportunity. It is this reason why Ben and I are always ready to pour more money into the market, which is exactly what we have been doing recently.
The market had crashed by about 10%, so we buy a little. If the market continues to crash, and we’re very happy if it does, then we will buy big. We consider a 10% fall to be a nice gesture from the market but 20% or more is a time to splash the cash big time. Everything is on sale!
The problem many people face is the emotional hurdle that a stock market crash creates, which is why many successful investors automate their investing. I take advantage of Interactive Investor’s free monthly investing service, so I don’t need to worry about exact timing. But I also buy big when everyone else is panicking.
If we look back at that FTSE 100 graph, we can see that it always recovers when people realise that it’s not the End of the World. We’re just showing you the data we could get our hands on, but we know this story goes back until the beginning of time – or at least the beginning of the FSTE 100.
FTSE 100 Total Return
Over time we know that dividends, particularly when reinvested, are the biggest drivers of investment performance. So worrying over short-term price fluctuations is completely unnecessary.
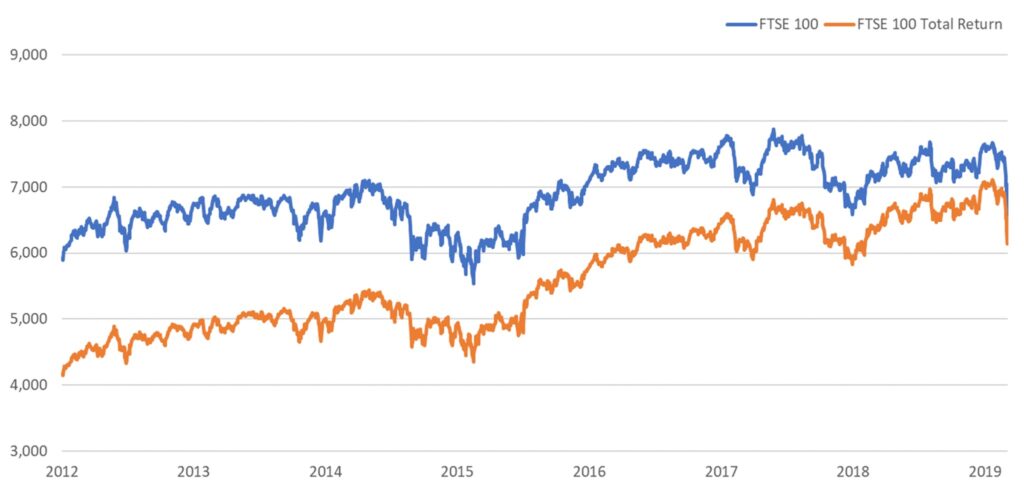
FTSE 100 Total Return
Above we’re looking at the FTSE 100 vs. FTSE 100 Total Return Index for about 7 years. Total return means that it also factors in the effect of dividends reinvested. From this graph we can’t really see too much. It appears that the Total return index just perfectly tracks the main FTSE 100 line.
However, we want to see relative performance so a technique we can use is to rebase the graph. Each line now starts at the same point, which will show us the real story.
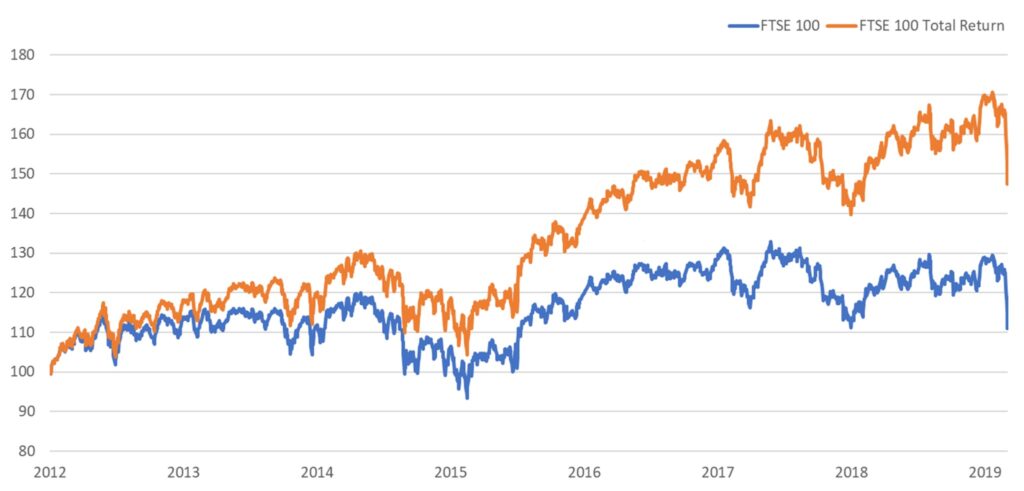
FTSE 100 Total Return - Rebased
We can now see that although the Total return line still mimics the FTSE 100, it quite quickly powers ahead and therefore the impact of small price fluctuations become less important as the end point is leaps and bounds ahead of the starting value and your original investment.
This is a key reason why we can both handle large price declines comfortably because we know that just by being invested in the market it is going to make us lots of money in the long term due to the power of dividends compounding our returns. We wish we had been able to show you a longer time period because the gap compounds even more and would become enormous but unfortunately, we couldn’t get our hands on the data.
Nevertheless, even in this 7-year period the difference is still significant with the FTSE 100 showing a return of just 10% but the FTSE 100 TR index returning around 50%.
Why Selling Immediately After A Crash is Stupid
Neither of the graphs we’ve looked at so far really demonstrates the size of the crashes and speed of recovery.
The next graph shows the week-on-week percentage movements of the FSTE 100. What we can see is that whenever we see a period of sharp decline, this is always followed by a quick reversal soon after.
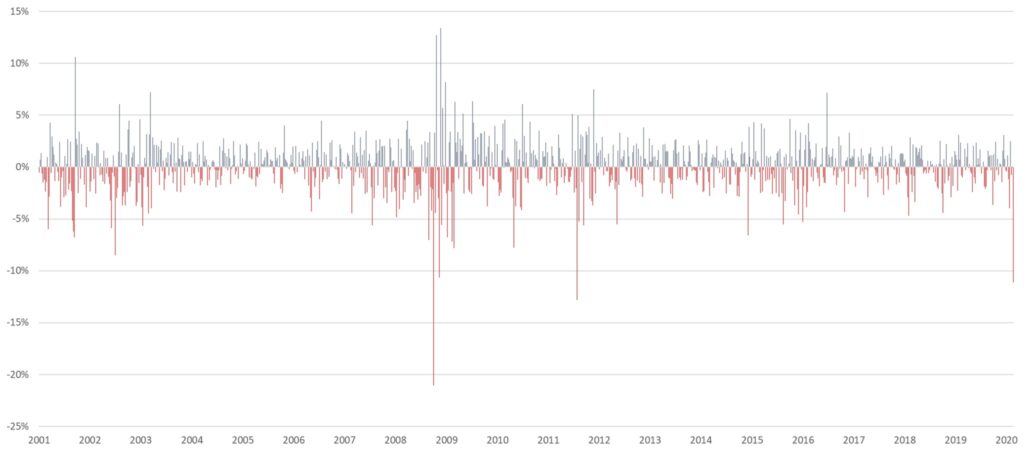
FTSE 100 Weekly Movements - Comebacks After Crashes
What we can see is large drops around 2001 relating to 9/11 and huge drops around 2008 due to the financial crisis. Then there’s a crash in 2011 due to the debt crisis. The last 20 years is littered with crashes and we’re sure the Coronavirus crash is just another blip on the graph as all that proceeded it have been.
What shocked us the most from this graph is the speed of the reversal in the weeks that followed a crash. The end of September 2001 saw the FSTE rally 10.59% in one week. In 2008 there was a week where it climbed 12.72% and another week shortly after rallying a further 13.41%.
The graph shows this pattern throughout the 20-year period. We’re betting the same will happen again now and in future.
If you sell immediately after the crash, you will miss out on these incredible price rallies. Shockingly people have very short-term memories and previous impending dooms are long forgotten.
When putting together this graph we had to look up the reasons for the crashes as we couldn’t remember either, but at the time they would have been all front-page news predicting the end of the World!
When Markets Crash, They Always Get Back Up Again
What About Individual Stocks?
We are very confident that overall markets will continue to climb until the end of time. However, we cannot say the same about individual stocks. The financial crisis saw the destruction of the banking sector and on the most part it never recovered.
When an index such as the FSTE 100 falls that’s fine by us but individual stocks fall and often never bounce back. Stocks have their own unique characteristics that can mean they become permanently damaged by whatever caused the price to decline.
For example, travel companies have had a particularly tough time recently. Who knows what a Pandemic could do to the long-term prospects of a travel company? A ban on travel could cause losses to spiral and the company could go bust before any chance of recovery. The difficulties of predicting the outcome is a major reason why we both limit our involvement with investing in individual stocks.
What You Should Do About The Crash
#1 Do Nothing
Assuming you own well-diversified index trackers, do not sell. If you’re the type of person who has an itchy trigger finger, then sometimes the best thing you can do is just not monitor financial news and these events will blow over before you even notice.
See the Opportunity in the Noise
#2 Buy Buy Buy
If you’re a little braver like us, then start buying when everything is on sale. As we’ve just seen in the graphs, very large downwards swings don’t happen very often. Make sure you’re ready to take advantage when they do. It is times like this which give stocks a huge advantage over less liquid asset classes such as property because you can take advantage of lower prices before they rise.
#3 Rebalance
Big swings will often leave your portfolio out of line with your intended allocation. This might be the time to rebalance. What this does is move money from the assets that have performed well, which perhaps have little room to grow, and allocates more to the past underperformers, which may have better opportunities.
How do you react during a stock market crash? Let us know in the comments section.
I’m continuing to buy monthly with HL with a focus on technology and infrastructure holdings. Only in year 1 of a ten year or so plan so , although now already suffering a paper loss – I’ll be buying on the downward trend thus ramping up the eventual ???long term profits.
I’ve been around 13 per cent down recently owing to having been in some profit. At time of this reply there’s been a bit of a bounce. But yes, I’m going to agree and with plenty of time ahead, I can wait a few years, and fingers crossed we can get a nice bull run going again.
Like most sites, Money Unshackled uses cookies - if you continue to browse our site, you are accepting our use of these tools, but you can modify your browser settings so as not to accept cookies!OK!Read More
Privacy & Cookies Policy
Privacy Overview
This website uses cookies to improve your experience while you navigate through the website. Out of these, the cookies that are categorized as necessary are stored on your browser as they are essential for the working of basic functionalities of the website. We also use third-party cookies that help us analyze and understand how you use this website. These cookies will be stored in your browser only with your consent. You also have the option to opt-out of these cookies. But opting out of some of these cookies may affect your browsing experience.
Necessary cookies are absolutely essential for the website to function properly. This category only includes cookies that ensures basic functionalities and security features of the website. These cookies do not store any personal information.
Any cookies that may not be particularly necessary for the website to function and is used specifically to collect user personal data via analytics, ads, other embedded contents are termed as non-necessary cookies. It is mandatory to procure user consent prior to running these cookies on your website.


3 Comments
I’m continuing to buy monthly with HL with a focus on technology and infrastructure holdings. Only in year 1 of a ten year or so plan so , although now already suffering a paper loss – I’ll be buying on the downward trend thus ramping up the eventual ???long term profits.
If this is your Year 1, what a great time to start when prices are so low!
I’ve been around 13 per cent down recently owing to having been in some profit. At time of this reply there’s been a bit of a bounce. But yes, I’m going to agree and with plenty of time ahead, I can wait a few years, and fingers crossed we can get a nice bull run going again.
Comments are closed for this article!