Why You Need To Avoid Fees and Taxes – and the Devastating Impact on Your Investment Portfolio

The impact of platform fees, trading fees and management fees on an investment portfolio can be disastrous to long term success – add in taxes, and the impact can be catastrophic.

Below we’ll work through several examples of how a person might invest their money in the stock market – what we think the best method is – and show how fees and taxes can wipe almost half off of your portfolio’s value.

YouTube Video > > >

Play Video

Our Investor

In these worked examples we assume that an investor is regularly saving £250 a month into an investment platform, achieving a return on investment of 6% after inflation. All long term forecasts have inflation factored in, so show the real money returns.

Unless you are an expert, you might expect to get similar returns from investing in shares as you could investing in Funds or ETFs, at least this is the assumption we have used.

Section 1: Fees – a hidden parasite

If you are investing in the stock market, you are going to have to navigate a whole ecosystem of fees.

Fees for making trades, fees for using a platform, fees to pay a Fund Manager’s salary, and a whole bunch of hidden admin fees that investment platforms and funds are less-than-transparent about revealing.

At Money Unshackled, we have long promoted low fee stock market vehicles such as ETFs, exchange traded funds, over more Fee-heavy vehicles of Managed Funds and even buying individual stocks directly, and now we’re going to show you why.

Fees4

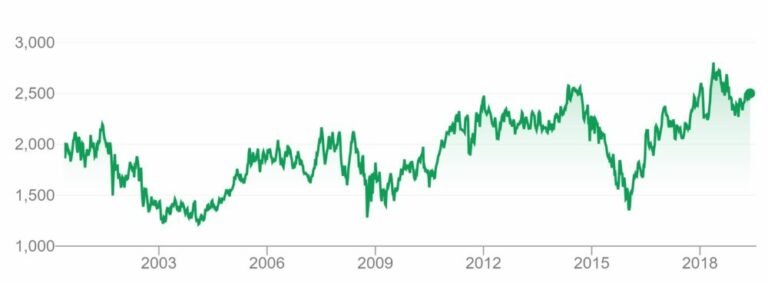
In green is our baseline – it’s how big our investor’s pot would be if left to grow over a 30 year term, adding £250 a month and compounding at 6% net return from growth and reinvested dividends. £244,000! Not a bad little pot to retire on.

30 years of industrious saving and investing giving you a result you deserve. But let’s now consider Fees.

Exchange Traded Funds

ETFs generally have the lowest fees. We’ve used as our example the Vanguard FTSE 100 ETF on the Vanguard platform, which has total fees of 0.26% – cheap as chips! Incidentally, their FTSE 250 ETF does have high transaction costs built in, making the total fee 0.4%.

For our example, we’ll use 0.26% as our example total ETF fee… and ask you to think twice about hidden transaction fees when you choose your ETFs!

If we’d invested in ETFs (the blue line in the chart above), our after-fees total pot size barely moves – we’re able to walk away with £233,000 with fees barely making a dent on our retirement.

Managed Funds

Managed Funds on the other hand are notorious for having high hidden fees. A popular UK fund we use an example is the Investec UK Alpha Fund J GBP Acc:

  1. Ongoing charges fee: 0.72% (includes Management Fee)
  2. Transaction Fee: 0.22%
  3. Platform Account fees of 0.25%
  4. Trading Fee on many popular platforms of £1 a time as a regular investment; £12 a year.

Total Fees on an example Fund: around 1.2% plus £12 a year

Investing in this fund will cost you 1.2% total fees. 1.2% doesn’t sound much, but consider that 1.2% knocked off your assumed 6% return gives you only a 4.8% return after fees. As we’ll see, the effect of this can be huge.

If we’d invested in Managed Funds (the orange line in the chart above), we’ve paid Fund Manager’s salaries and other costs of tens of thousands of pounds over the years, leaving us with only £196,000 to spend on ourselves.

Don't let your wealth fly away

Stocks and Shares

And finally, by buying shares individually you will incur lots of different fees, including but not limited to ongoing platform fees, stamp duty on trades, and regular platform trading fees.

You will need to regularly rebalance a portfolio of shares to keep your portfolio performing – we estimate this costs £200 a year on a 20 stock portfolio: 20 trades a year at around £10 a pop.

Other fees are stamp duty on rebalancing: which might be 0.125% a year on our portfolio [0.5% stamp * ¼ of our portfolio each year] if we assume we annually rebase a quarter of the value of our portfolio, platform account fees of, let’s say, 0.25%, and another £45 a year for trading and stamp duty on new deposits.

Total fees an example individual stocks portfolio = 0.375% plus £245 a year.

If the investor thought that they knew best and invested directly into shares, returning the same as a Fund manager could achieve, they’d have performed a little better after fees, keeping £210k to play with in retirement – the purple line in the chart above.

Of course, this assumes you know what you’re doing and are able to get the return before fees as a Fund Manager! And that you don’t have an itchy trigger finger and trade even more frequently!

The effect of fees is truly scary – the moral is, unless you think you can beat the market, tracking the market with an ETF will generally pay off better. It’s all in the Fees.

Section 2: The Greedy Tax-Man

Don’t forget that as an investor, the government feels it is entitled to take chunks of your invested savings for itself, despite you doing the “right thing” and planning for your future.

By investing, you will be less of a burden on the state as you will be able to sustain yourself through retirement rather than rely on the government for handouts, but this point is lost on the Treasury.

In any case, if you invest without shielding yourself from tax, you will be stung, and stung hard.

Tax is largely dependent on your circumstance, so let’s show a high level assumption of what out investor’s pot would look like as a higher rate taxpayer if he invested in ETFs vs Managed Funds, after fees.

A higher rate taxpayer will be taxed a crippling 32.5% dividend tax! We’ve assumed half of your return comes from dividends, and have factored in the £2k dividend tax threshold.

Fees7

Starting again at our baseline (the green line), lets now look at what a higher rate taxpayer would expect to keep investing in ETFs and Funds. A higher rate taxpayer might keep only £208k investing in ETFs (blue), while a higher rate taxpayer investing in Managed Funds (orange) might only keep £176,000 of their potential pot size – on the way to half your pot being lost to Fees and Taxes!

Stocks and Shares ISA

There is of course a way to protect yourself from Taxes. Just like ETFs have been created to avoid Fees, ISAs have been invented to avoid taxes – and legally.

A Stocks and Shares ISA works much like a regular Cash ISA, in that the returns within are shielded from taxes.

There are some exceptions that can’t be avoided, such as US Foreign Withholding Taxes of 0.15%, but for a UK investor investing solely in UK stocks this shouldn’t be an issue for you.

Conclusion

The ultimate Fee and Tax busting combo is therefore an ETF based portfolio, built up through an ISA, as below:

Fees8

Of course there is still reason to buy stocks and shares directly alongside ETFs, and we do this ourselves – if you know what you are doing, and have seen an opportunity for market beating value, it is of course possible to do better than the scenarios detailed here.

But for most of us, following a strategy of Fee and Tax minimisation is the key to a successful long term investment plan.

Have you put much thought into Fees? And are you making use of your ISA allowances? Let us know in the comments below.

Interactive Investor Review – New Charges – Best UK Investment Platform?

We get asked this question all the time – What is the best investment platform? But sadly, there isn’t a clear-cut winner. It all depends on the service or functionality that you want and the amount of money that you have invested and your investment style.

Previously we’ve praised Interactive Investor for those that have a decent amount invested. But from the 1st June 2019 they’ve introduced new charges. So, does Interactive Investor still cut the mustard?

Here we review Interactive Investor and see if it’s still the best investment platform for UK investors. Let’s check it out…

YouTube Video > > >

Play Video

What Accounts do they offer?

Interactive Investor offer a wide range of accounts including ISA, SIPP, Junior ISA and General Trading Accounts. We expect these as standard but it’s not uncommon for other platforms to only offer a general account, which means you could be liable to pay taxes on your gains and dividend tax.

So called “free” platforms such as Freetrade do offer an ISA but have additional charges for these. So, Interactive Investor including all these accounts as standard is great but note there wasn’t a Lifetime ISA option, which might be a disappointment for some of you.

Of course, those that watch our YouTube channel on a regular basis will know we strive for financial freedom today, so the standard Investment ISA is our weapon of choice.

What is the Right Fee Structure? Percentage Fee vs. Flat Fee

Generally, there are 2 type of fee structures for investment platforms: –

  • Percentage fee, which will see the total charge increase as your investment pot increases.
  • And a Flat fee, which stays the same as your investment pot grows

As you can imagine you don’t want to be paying a percentage fee if you have a lot of money.

For example, AJ Bell offer a low percentage fee of just 0.25% but if you’ve managed to build up a large investment pot of say £200,000, that 0.25% would be an annual charge of £500.

If you have built up a pot £500,000, which you might do if you’re serious about financial freedom then it would be a charge £1,250.

This is simply getting ridiculous on the larger pot sizes.

This is where the white knight Interactive Investor comes riding in to save us with their friendly flat fee pricing.  No matter how much your pot size grows Interactive Investor are going to charge you the same amount.

knight-2565957
White Knight To The Rescue

What are the charges?

They used to offer what we thought was a very good price at £90 per year (£22.50 per quarter). But sadly, they just increased this to £10 per month, so £120 per year.

Despite the disappointment with the cost increase it doesn’t really change too much, albeit you need a little more money to make Interactive Investor the lowest cost platform.

Service Plans
Interactive Investor Service Plans

In fact, Interactive investor don’t just charge £10 a month. They’ve introduced 3 service plans at different prices with the £10 plan being the cheapest. Whilst this does make things more complicated to compare, it does benefit those that trade frequently, as you will get lower trading costs on the more expensive plans.

Here at Money Unshackled we encourage you to trade less frequently and hold for the long term, so we don’t really see the need to be on the more expensive service plans. Those that trade frequently tend to underperform due to clocking up lots of trading fees. Because of this we’ll be basing the rest of the review on the cheapest ‘Investor Plan’.

A positive change they’ve made is the reduction of trading fees from £10 to £8, which is a very welcome change indeed.

The great thing about Interactive Investor is they actually give you the equivalent of 1 free trade per month. This is £8 credit to spend on whatever trades you like, so really can make Interactive Investor a cheap platform even for those without a huge amount of money.

Unfortunately, those credits expire after 90 days, which isn’t long. We think under the old prices, they used to last 12 months.

Other Services

Interactive Investor isn’t just a 1 trick pony. They have 1 of the best service offerings out there. And in their words, you “Get access to more investment opportunities than any other provider in the market”

This includes access to 40,000 shares across 17 global exchanges, over 3,000 funds, investment trusts, ETF’s and more. This superb range just isn’t provided by cheaper alternatives.

One of the features we like is Regular Investing, which allows you to invest on a monthly basis for just £0.99 per trade. We both feel that regular investing is one of the best ways to build significant wealth.

They also provide a dividend reinvestment service for just £0.99. Another service that many cheaper platforms don’t offer.

They also have a contact phone number…Wow! Don’t underestimate this. When you have a lot of money invested and you need help you may want to speak to a person. Not all investment platforms make it so easy.

Summary

To summarise, we feel Interactive investor is ideal for those with larger pot sizes, or even those that will have a large pot size in the near future.

The monthly free credit is also great, which depending on your frequency of trading can make Interactive Investor one of the cheapest platforms even for smaller pots.

What do you look for in an investment platform? Let us know in the comments section.

Investing in Unilever Stock (ULVR) – Should You Buy?

Unilever is one of the biggest companies in the world and yet many people have no idea who they are or what they do. But we guarantee that almost everyone has purchased their products.

Does their global reach and huge product range make Unilever stock an essential part of every investor’s portfolio? Offering an amazing dividend that keeps getting bigger and a strong balance sheet, surely this is the stock of dreams?

So, who are Unilever? How do their fundamentals look? What does Unilever’s future look like? And is it worth investing in?

YouTube Video > > >

Play Video

Who are Unilever?

Unilever are one of the companies we featured in our very popular Youtube video ‘Best Dividend Stocks UK’.

The company is a colossus with a market cap of whopping £127b, which is up from £109b in that previous video, so that’s some nice growth in such a short time.

Next time you’re in a supermarket or even just look in your cupboards and check out the manufacturer of those products. We bet a large majority of these are owned by just a small number of companies – Unilever being one of them.

In fact, according to Unilever, “Seven out of every ten households around the world contain at least one Unilever product.” They also own over 400 brands with 13 of these having sales of over one billion euros.

We love this company because brands, and lots of them, create a protective moat, which make it very difficult for competitors to enter the market. A protective moat is a key thing legendary investor Warren Buffet looks for when investing. Consumers tend to have loyalty with their favourite brands and keep coming back.

Not only does this give Unilever a more predictable income stream but it allows them to charge more than competitors – often a lot more. Take Domestos, Supermarkets tend to charge about £1 for a bottle but the non-branded supermarket version is around 45p – For essentially the same product. This is a whole lot of extra margin for Unilever.

Domestos - A Unilever Brand

Unilever’s Geographic Reach

They are also hugely diversified in terms of geographical reach with exposure to markets all around the world with particular exposure to emerging economies. It is these countries where large growth is expected to come from.

In fact, almost half their revenue comes from this area. Strong brands across many geographical markets make it less risky for investors…perhaps.

Remember as an investor you’re looking to stack the odds in your favour.

Dividend and Yield

The dividend yield is certainly not the highest in the FTSE 100 but it’s still decent at 2.80% with a healthy dividend cover of 1.52.

A rising dividend with healthy cover is exactly what you want to look for when constructing a dividend portfolio. Unilever even pay out the dividend on a consistent quarterly basis, which is great for your cashflow.

Bear in mind that Unilever now decides dividends in euros, so while the dividend is consistently rising in euro terms, UK investors will see a level of volatility due to currency exchange rates.

Unilever Dividend History Chart
Source: dividenddata.co.uk

Share Price

Just look at that share price growth on top of any dividend payouts. Whilst a chart like this is historical and not necessarily an indicator of the future, it goes to show that performance has been good.

Whilst your investment style will dictate whether this is good or bad, we tend to like this consistent growth. Stocks that show sharp drops may look like opportunities, but it is far too common to get stung again as further drops often occur. I should know as I’ve been stung a few times myself.

Unilever Chart
Unilever Share Price History

Earnings

We find the best place to go for information on earnings for any stock is the companies accounts. Investment Websites are good but can sometimes have errors. Unfortunately, annual accounts are long, complicated and extremely boring.

Revenue has hovered around the €50b mark for past 3 years but despite this they have managed to grow Net Profit and EPS. Bear in mind that we see a huge surge in non-underlying items. By following the notes, you can find that this relates to the disposal of its Spreads business. These sorts of gains are one-offs and should be treated as such when analysing stocks.

Whilst a full analysis of earnings goes beyond the scope of this article, we are happy with the company’s earnings.

Price Earnings Ratio

According the Hargreaves Lansdown the P/E ratio is 19.80, which is based on the adjusted EPS – This is excluding non-recurring items, which we assume to be things like the disposal of the spreads business just mentioned.

This is high when compared to the FTSE 100 PE of about 15 but we think that Unilever has better growth prospects and certainly more protection against a price drop.

Risks

Unilever relies on the power of its brands. They need to ensure that their brands stay relevant.

Changing consumer demands and even new taxes such as sugar tax can have a huge detrimental impact on Unilever’s business. Then there is the problem with plastic packaging. Unilever needs to find a way to reduce its use of plastic.

Customers are becoming more concerned with the environment and are beginning to avoid products that unnecessarily damage the environment. There is also taxes and fines that will damage profitability if they don’t act on this now.

Do you like the look of Unilever Shares and will you be investing? Let us know your opinion in the comments section.

lump-sugar-548647

FIRE Financial Freedom – Financial Independence Retire Early

The Financial Independence, Retire Early Movement, or FIRE movement for short is a lifestyle choice to retire early by gaining financial independence at a relatively young age – usually aiming to retire in their thirties or forties at the latest.

In one way it’s something we’ve been teaching on our channel from the very beginning but never referred to it by its name.

YouTube Video > > >

When we talk to people about early retirement, we generally get 1 of 3 responses:

  1. Complete and utter disbelief that it’s even possible – often accompanied by the sentence, “I can’t retire for another 40 or 50 years.” This really grinds our gears as these people have given in at life before they’ve even started, accepting a state dictated retirement date.
  1. Criticism for some reason for wanting to live your life to the full. Often accompanied by the sentence, “I wouldn’t know what to do” or “I’d be bored”. Honestly, we don’t get this one at all. Why on earth would these people not want to be masters of their own destiny.
  1. And a response that finally makes sense – general excitement and a desire to know how.

So, what is the FIRE lifestyle? How is it done? Do we agree with it? And can it really be achieved?

Your Money Or Your Life

Although we think the concept of Financial Independence, Retire Early must have been around since the beginning of time, many of the main ideas have been credited to the best-selling book Your Money or Your Life, linked here, so make sure to get yourself a copy. If you learn anything from this book, then it’s been worth the price.

What is FIRE?

FIRE‘s formula is very simple: spend less than you earn and invest the surplus. FIRE is achieved through aggressive saving – and we’re not just talking about a bog standard 10-15%.

The objective is to accumulate assets until the resulting passive income provides enough money to cover living expenses in perpetuity.

If you can only save 10%, then it will take 9 years to save for 1 year of living expenses.

However, if you can pump those up to a 50% saving rate, then that is just 1 year of work to save for 1 year of living expenses.

Some people are able to go even further to 75% and beyond. Also factor in some investment growth and you’ll be financially independent in no time.

poo-630200
We're not talking bull... honest

We can sense some people will think that’s impossible and that we, and all those that preach this stuff, are chatting complete bull.

So, How is it done?

Those seeking to attain FIRE intentionally maximize their savings rate by finding ways to increase income or decrease expenses.

The extent of how much you decrease expenses is up to you. If you can live off and are happy to live off rice, live in a tent and do nothing else, then you can probably save quite a high percentage of your income.

But most people, including us are unwilling to go to such extremes.

You can of course cut out all the unnecessary spending, and if you follow the teachings in Your Money or Your Life you will identify every single penny that comes into and out of your life.

This way you’ll finally see where you spend and potentially waste money.

We prefer to increase earnings, whilst being semi frugal.

campbell-boulanger-348386-unsplash
Do you really need this?

Some ways we each maximise our savings rates is by increasing our earnings through multiple streams of passive income.

This includes ad revenue, which you may have seen on our YouTube videos and affiliate marketing.

We are also now live with the MoneyUnshackled.com website, which will bring more helpful information to you and hopefully an even wider audience.

Supporters of FIRE suggest the use of 4% as a safe withdrawal rate, meaning you would need an investment pot of 25 times your annual living expenses.

Of course, the 4% rule may be too high, but it could also be argued that you need far less if your investments perform far better than the stock market average.

youtube egg
The most liked video on YouTube - this could make some serious passive ad revenue

A few investment properties could return 20%+. We’ve done a video on how this is possible, here.

Do we agree with it and can it really be achieved?

Absolutely. Personally, neither of us would want to scrimp and save to the point life was no fun but FIRE is not much different to what wealthy people have done for generations – living off their wealth.

Achieving it is not easy otherwise everyone would do it. But if you can build your income and keep lifestyle inflation to a minimum you can definitely achieve it.

We’re both already on the path to Financial Freedom and would love for you to join us.

“But I don’t want to retire”

Upon reaching financial independence, paid work becomes optional – you don’t have to retire.

For some reason, many people get confused with what freedom is.

You are free to do what you want. If that is work, in whatever form, then so be it.

Are you or will you be living a FIRE lifestyle? If so, we want to hear how you are doing this. Let us know in the comments section.

Investing In Royal Dutch Shell (RDSB_RDSA) Stock – Should You Buy?

Shell is the FTSE 100’s Oil goliath, and for us investors, the most striking thing about it is its whopping dividend yield, ticking along around 5.75%.

As lovers of cash flow, this is an amazing yield for our portfolios, alongside capital growth. But dividends have been flat for the last several years, with experts not expecting any sudden rises in the short term.

Is the UK stock market’s number one Oil kingpin still worth investing in?

The FTSE 100 – still a haven for Blue Chip Companies

Doom-mongers in the media like to imagine that Brexit and US/China tensions is going to spell the death of the world economy, despite centuries of growth, innovation and prosperity. But companies like Shell laugh in the face of such negativity.

Shell is a cornerstone company of the FTSE 100, the UK’s top index, making up over 11% of the value of the top 100 companies all by itself, but is global in its nature.

Dividends

Dividends – Good Yield, But Where’s My Growth?

Check out their recent dividend history. Shell have flat-lined their dividend payouts at $1.88 for the past 5 years, and are forecast to continue this trend into the current year. Shell announces their dividends in US Dollars because they are an epic global company, and Dollars are the currency of the world. And oil is of course priced in dollars.

They choose to be listed on the UK stock exchange, but like many companies in the FTSE100, their trade is global.

What does this flat dividend line mean for us as investors? Well, the dividend yield is currently 5.75%, which is fantastic for a Blue Chip company, but this chart tells us that Shell aren’t willing or aren’t able to grow their dividends, so investors have been losing out each year to inflation. We like to see companies growing dividends at least in line with inflation.

A reliable 5.75% yield is worth hanging around for though, so let’s look at how recent capital growth in the stock price stacks up to see if that helps sweeten the deal.

Royal Dutch Shell (RDSB) Share Price History

Source: Google

Shell’s Stock Price

Here’s Shell’s recent stock price history. We can see that it’s been tracking slightly upwards over the years, and is currently at a relatively high price point when compared to its recent history. Could this mean the price is more likely to fall than rise in the next couple of years?

It’s impossible to say, but with the US/China trade war and a pinch of Brexit uncertainty, we wouldn’t be surprised if the share price were to fall in the short term – especially if a global downturn occurred, which would likely effect oil prices. But Shell’s history of steady share price growth is one check in the “pro” column for this stock.

PE Ratio

Price Earnings Ratio

Shell had a Price Earnings ratio at April 2019 of 11.3. The price earnings ratio is calculated as Share Price divided by earnings Per Share, so the higher the share price, the higher the Price Earnings ratio. Likewise, if the company’s earnings fell, the PE ratio would increase.

We want to see a low PE ratio relative to a company’s history and to its competitors, so we know we’re getting value for our invested money.

But don’t forget this can also be a signal that its future might be bleak – perhaps other investors know something you don’t.

We can see that the share price had fallen over the last couple of years relative to earnings, so to invest now would be at a bargain price compared to a couple of years ago.

11.3 is also low compared to one of Shell’s main competitors in the Oil industry, Exxon Mobil, who has a PE Ratio of 16.5 at April 2019.

Shell’s PE ratio is 32% lower than Exxon’s, possibly making Shell a good place to invest in Oil in terms of the value of share capital.


Long Term Investment Horizon

We also need to look at soft factors when predicting the future performance of a stock.

Let’s look at the long term bumps in the road for Shell investors:

Fracking
Drilling for Oil

Oil as a Dying Fuel

There isn’t much of a worry that Oil is disappearing as a world resource anytime soon, despite public perception. There’s TONNES of the stuff under the ground, and new sources are being found all the time.

The problems are rather practical and political. New sources of oil are being found in the world’s oceans, but getting drills to them isn’t easy – and there’s the environmental impact of accessing that oil to consider.

Protest
Millennials demanding cleaner energy

New fracking technology could keep the oil industry going for a long time, but there is strong political push back against such projects due to the perceived impact on the environment.

As the world turns to new energy sources such as wind and solar, demand for oil will likely fall. But a company as big as Shell surely would adapt to such an eventuality.

Besides, when the sun isn’t shining, and the wind isn’t blowing, Oil is going to be one of our main fall-back fuels for many years to come.

Rain
When the sun isn’t shining, and the wind isn’t blowing, oil will be needed

Should I Buy Shell Stock?

In Summary, we believe Shell is a reasonable stock to hold in your portfolio.

Its high dividend yield, solid PE ratio, steady share price growth and strong history as a staple of the FTSE100 make it a dependable cash flow asset.

But its dividend payout is not increasing, and its long term horizon is littered with potential political pitfalls as the Millennial Generation demand cleaner energy.

Andy has held Shell in his portfolio for many years and will continue to hold, whilst those juicy cash flows keep coming in. But buying directly into individual stocks is not the only way.

There are alternatives to buying Shell stock directly – being such a large chunk of the FTSE100, you could invest in a FTSE100 tracker, which gives you exposure to this great company but also diversifies you across the rest of the top companies in the index.

Do you hold Shell shares in your portfolio? How do you rate its performance? Let us know in the comments section.

Investing In Coca Cola (KO) Stock – Should You Buy?

Coca Cola is probably the best known brand in the world and is one of the biggest US blue chip companies.  Investors recognise Coke as a strong dividend payer, and at first glance it should be a great fit in our portfolios at Money Unshackled, given that we crave dependable passive income.

But recent years have seen Coke struggle in a new world obsessed with ethics & health, and with a rocky world economy. Is Coca Cola still worth investing in?

Blue chips in poker

Why We Like Blue Chip Dividend Stocks

Blue Chip stocks get their moniker from the game of Poker, where traditionally the “blue chips” hold the highest value. In the stock market, blue chip companies are the biggest, most established global companies, and tend to offer their investors dependable dividends in place of fast growth.

You’re never going to get rich overnight by holding a blue chip stock, as they are mostly already past their main growth stages.

But our portfolios benefit from holding a foundation of these dependable assets that provide steady cash flow to support our lifestyles.

Dividends

Dependable Dividends

This is what we mean by dependable.

Dividend investors have seen big rewards from holding Coca-Cola stock, with more than 50 years of consistent, reliable dividend growth. The current annualised dividend payout is forecast at $1.60 for 2019, and pays quarterly, with 40 cents paid already in March 2019.

The current yield on the share price is 3.38%, which is around what it has been historically too. A company cannot control its yield percentage as it cannot control its share price, so the consistent dollar returns are what we look at for historical analysis.

But as investors we like to know what the current percentage rate of return is too, and 3.38% is pretty decent if we can also achieve capital growth on top too.

Share Price

Coke’s Stock Price (KO)

A mid-range dividend means we also crave returns from stock price growth to sweeten the deal. Here’s Coke’s recent stock price history. We primarily care about the last several years when looking at stock price as it’s the best indicator of current performance, but even this is highly imperfect as an indicator of future performance.

The best we can take from looking at the share price history is that Coca Cola’s share price has been steadily growing at a consistent rate, with regular peaks and troughs. This gives us some confidence that Coke will continue to experience price growth to supplement our gains from dividends.

The low volatility gives us a little bit of comfort which may help you sleep at night.

PE Ratio

Coca Cola’s Price Earnings Ratio

Coca Cola had a Price Earnings Ratio of 31 at March 2019. The price earnings ratio is calculated as Share Price divided by earnings Per Share, so the higher the share price relative to earnings, the higher the Price Earnings ratio. Likewise, if Earnings per share reduced, the PE ratio would increase.

This is what happened in late 2017/early 2018 when we saw a spike in PE ratio, due to a one-time charge of $3.6bn related to the repatriation of overseas earnings following the Tax Reform Act in the US, temporarily hurting Coca-Cola’s net earnings, which fell by 81%.

The PE ratio has now settled back down to around the 30 mark, where historically it had been around 20. This higher PE ratio of 31.2 compared to the history could mean that Coca Cola stocks are now overpriced compared to the value you could attain pre 2017.

But how does Coca Cola’s PE Ratio compare to other companies? In the US beverage industry, the average PE Ratio is around 27, with the market as a whole averaging around 18.

This suggests that Coke is overpriced compared to both the industry and the market.

Coca Cola as part of everyday life

Stock Picking – Soft Factors

There are many soft factors that we must look at when predicting the future performance of a stock.

The financial histories we have just looked at are historical, not current, and definitely don’t reflect the future, rather they only hint at how capable the company has been up until now.

Here’s 5 soft factors we should consider alongside the numbers

1)            Endorsed by the wallet

A good endorsement of a stock is whether investment gurus actually put their money where their mouth is and buy it.

Warren Buffet is the biggest guru of them all, and he holds significant shares in Coca Cola.

We could all do a lot worse than following Warren Buffet, and this endorsement by the wallet is a check in Coke’s favour.

Brand power is everything in business

2)            Brand Power

Coca Cola has been around for more than a century and its brand has endured the test of time. It consistently tops the list of world’s most recognised brands, and is part of the everyday lives of billions of people worldwide. This supports the theory that Coca Cola is a stable business that will continue to deliver dividends to its shareholders, and it’s everyday use by billions makes Coke a safe haven during market downturns.

3)            Competition

Coke doesn’t really have to worry too much about competition. It is by far the market leader in the carbonated beverages market, and it’s customers are loyal – Coke are masters of marketing , with adverts that show Coke as being part of everyday life. We all have a preference between Coke and Pepsi, and given the choice will stick faithfully to our drink of choice.

Coke is a global company that dominates the market in many developing nations, with opportunity still for growth in foreign markets.

Sugar - The 21st Century Bogeyman

4)            Sugar – the 21st Century Bogeyman

The world is waking up to the fact that sugar has direct links to obesity and Type 2 diabetes, and governments are starting to take action against companies with products that contain significant amounts of the stuff – products like Coke.

In the UK, the Sugar tax has artificially inflated the price of a bottle of Coke above what would be the market rate – perhaps not significantly enough to make a bottle unaffordable, but it has certainly had the effect of highlighting to the public that the drinks they are buying are considered unhealthy.

Luckily for Coca Cola, of their 3 main products, Diet Coke and Coke Zero are both incredibly popular and seen as alternatives to original full sugar Coke, and sales of these Diet Coke and Coke Zero have risen massively in the last few years. In the UK, Coke Zero is already the biggest selling drink-even more popular than the original Coca-Cola.

We think that Coca Cola’s low sugar range and diversification into non-cola products like it’s purchase of Costa Coffee in the UK will allow them to weather this storm, but the continuing focus on health is a risk factor to consider

Main products Diet Coke and Coke Zero both contain alternatives to sugar that are also considered by most health bodies to be bad for health.

The public is becoming less forgiving of litter and waste

5)            Environmental concerns

One factor to keep on your radar is environmental and green regulations that will likely come down the line in the years to come. As investors we buy for the long term, and the world’s renewed focus on plastic and other waste could mean that in the next decade there will be crackdowns on products with single use containers like those sold by Coca Cola.

As a producer of billions of bottles and cans, Coke is indirectly one of the main contributors to litter in the environment, and we would expect Coke to be among the companies first on the firing line if world governments decide to act.

We expect they would still survive, but the share price would likely take a beating in this scenario.

Everyone has a preference

Should I Buy Coca Cola Stock?

In summary, we believe Coca Cola is a reasonable stock to hold in your portfolio. Its consistent dividend, steady share price growth and strong brand and customer base make it a dependable cash flow asset.

But its yield is not that great, and the future is littered with potential pitfalls as the health and environmental lobbies gain in strength and legal backing. Also, that PE Ratio gave us cause for concern as it suggests Coke’s stocks might be overpriced compared to its own history and against other stocks in the industry.

There are better dividend stocks out there, and if your portfolio is small and your investable cash is limited, you might instead choose to place your cash into alternative holdings.

Do you hold Coca Cola stock in your portfolio? How do you rate it’s performance? Let us know in the comments below.

Investing In Coca Cola (KO) Stock – Should You Buy? Video Review:

YouTube Video > > >

Play Video